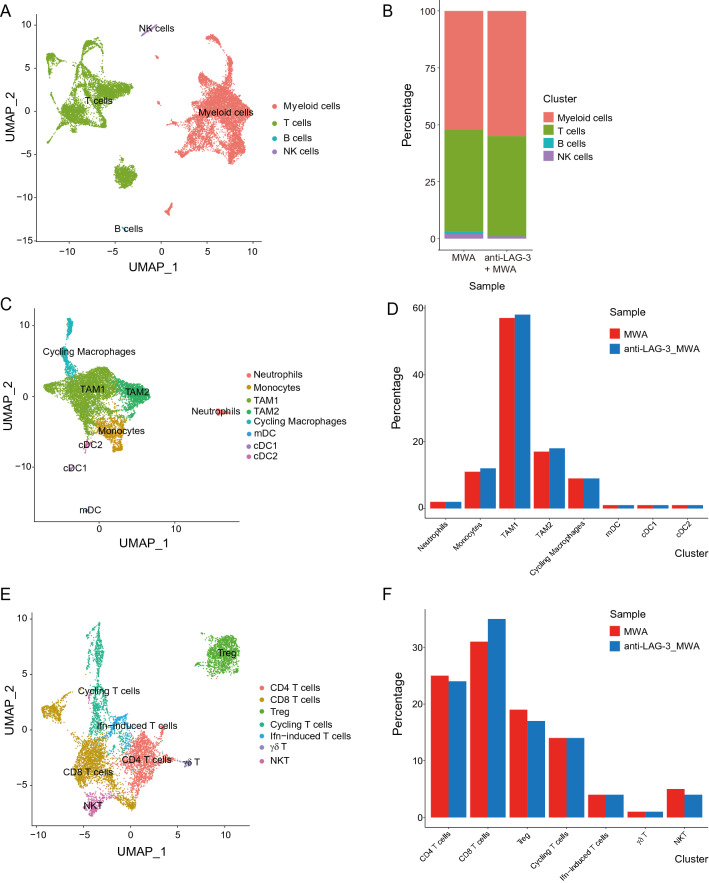
Fig. 4.
Transcriptional landscape of TME in the MWA alone and MWA combined with LAG3 blockade groups. A and B. UMAP analysis of all the cells in TME of the MWA alone or MWA combined with the LAG3 blockade group and the proportions of different subpopulations in each sample (MWA group: 8971 cells; MWA combined with the LAG3 blockade group: 8733 cells). C and D. UMAP analysis of all the myeloid cells in TME of the MWA alone or MWA combined with LAG3 blockade group and the proportions of different subpopulations in each sample. E and F. UMAP analysis of all the lymphocytes in TME of the MWA alone or MWA combined with LAG3 blockade group and the proportions of different subpopulations in each sample

