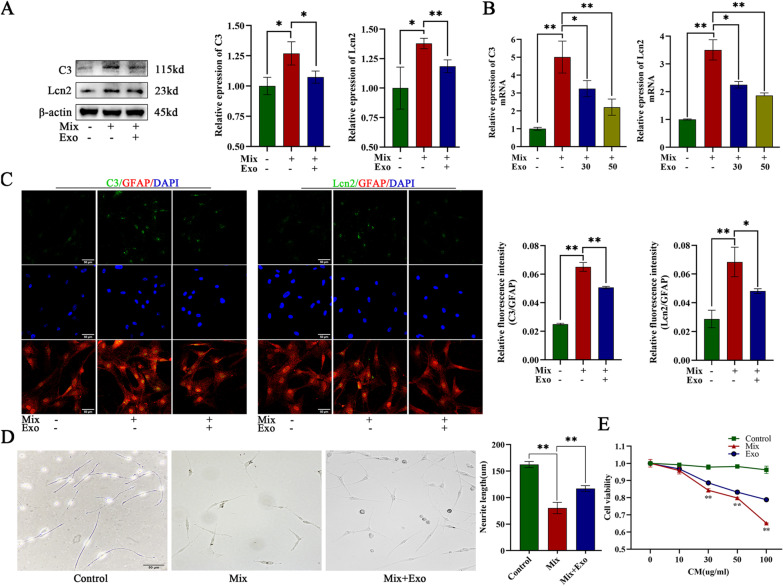
Fig. 1.
Exosomes reduced toxicity of neurotoxic astrocytes in vitro. a, b Representative western blot images and quantitative analysis of C3 and Lcn2 gene expression in control astrocytes, mixture (TNFα, IL1β, C1q)-induced astrocytes (neurotoxic astrocytes) and exosomes treated neurotoxic astrocytes. c Representative immunostaining images of GFAP (red)/C3 (green)/Lcn2 (green) and the quantification of the relative immunofluorescence intensity of C3 and Lcn2 in each group. Scale bar = 50 μm. d Representative images and quantitative analysis of neurite length in NGF-stimulated PC12 cells treated with conditioned medium (CM) of primary astrocytes (Control), neurotoxic astrocytes (Mix) and exosomes treated neurotoxic astrocytes (Mix-Exo). Scale bar = 50 μm. e Cell viability of PC12 cells treated with conditioned medium of different groups. Data above are represented as mean ± SD. *, p < 0.05; **, p < 0.01. C3, complement c3. Lcn2, lipocalin-2. NGF neuronal growth factor. TNFα, tumor necrosis factor α. IL1β, interleukin 1β. C1q, complement 1q

