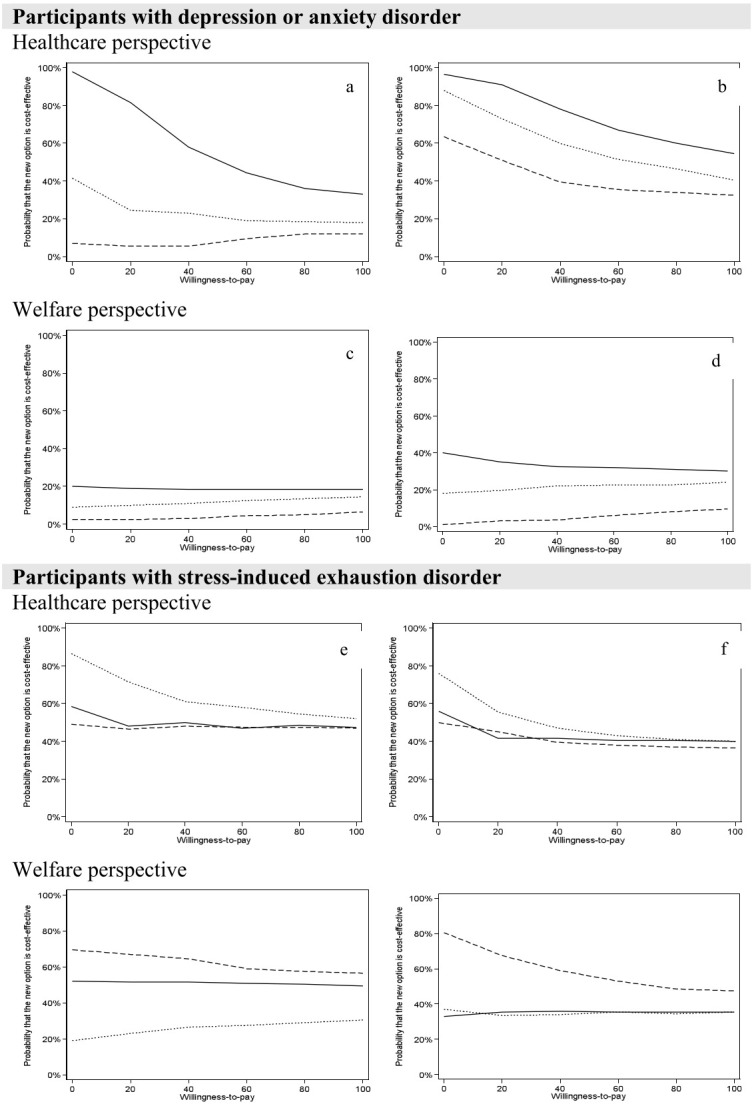
Figure 3.

Cost-effectiveness acceptability curves for ACT, WDI, ACD+WDI compared with TAU over one- (left) and two (right) years follow-up for Depression and anxiety disorders and Stress-induced exhaustion disorder, respectively. ACT – solid line, WDI - dashed line, ACT+WDI - dotted line.
