Figure 2.
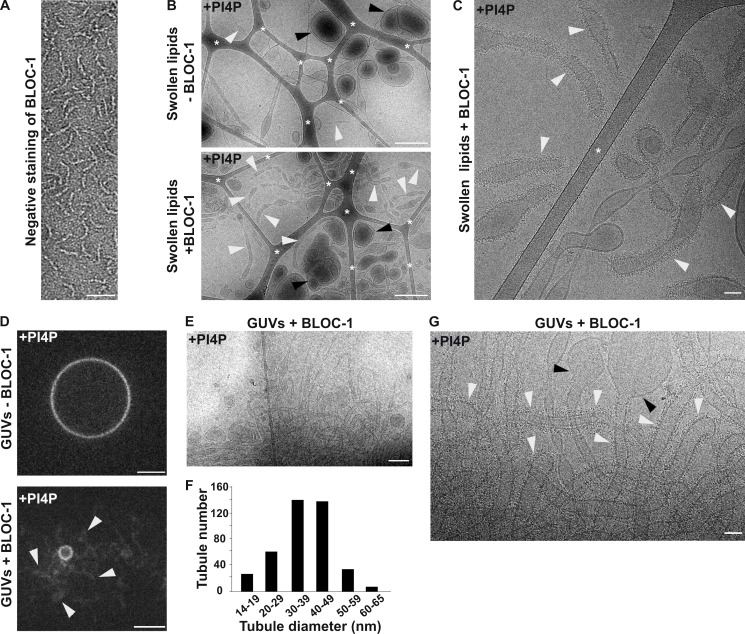
BLOC-1 generates tubules from PI4P-containing membranes in vitro. (A) Negatively stained image of BLOC-1 by EM. (B) Cryo-EM images of a resuspended lipid mixture of EPC/PS/PI4P before (top) or after (bottom) incubation with BLOC-1. Vesicles (black arrowheads) and tubules (white arrowheads) of different sizes and shapes are visible. (C) Cryo-EM image of PI4P+ membrane tubules with BLOC-1 bound (white arrowheads). (D) Fluorescent microscopy of EPC/DOPS/PI4P GUVs before (top) or after (bottom) addition of BLOC-1; note the formation of tubules (arrowheads) from the GUV when BLOC-1 was added (see also Video 1). (E) Cryo-EM image of the BLOC-1-containing GUVs preparation shown in D (bottom) revealing many BLOC-1-coated tubules. (F) Plot of the diameter of tubules generated with BLOC-1 from PI4P+ GUVs (n > 100 tubes analyzed with 4–5 independent measures/tube). (G) Higher magnification cryo-EM image as in E of BLOC-1-coated tubules (white arrowheads) and of vesicles devoid of BLOC-1 (black arrowheads). In B and C, asterisks indicate the carbon network of the grid. Figures are representative of at least three independent experiments. Scale bars: (A) 25 nm, (B and E) 500 nm, (C and G) 50 nm, (D) 5 μm.

