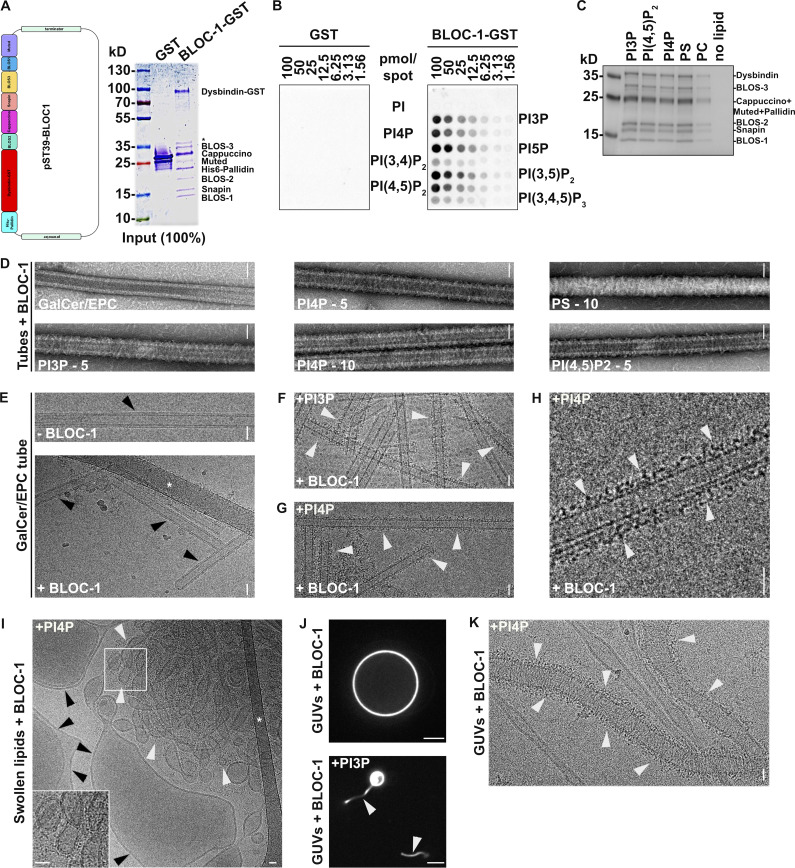
Figure S2.
BLOC-1 binding to vesicles and formation of tubules. (A) Schematic of the polycistronic expression cassettes used for the expression and purification of recombinant BLOC-1 (left) and Coomassie Blue-stained SDS-PAGE gel of purified GST and BLOC-1-GST (right). (B) Lipid strip assay showing interaction of purified GST (left) or BLOC-1-GST (right) with PIxPs. (C) SDS-PAGE and Coommassie Blue staining analysis of BLOC-1 binding to lipid vesicles doped with negatively charged (PI3P, PI[4,5]P2, PI4P, PS) or neutral (PC) phospholipids and fractionated by flotation; only top fractions are shown. (D) Imaging by negative staining EM of BLOC-1 binding to GalCer/EPC nanotubes doped or not with PIxP or PS (5 or 10%, as indicated). BLOC-1 bound to negatively charged GalCer/EPC nanotubes (n = 100 tubes/condition, 100% of nanotubes with BLOC-1 bound per condition) compared to control tubes (n = 30 tubes, 0% bound). (E) Cryo-EM images of control GalCer/EPC nanotubes in the absence (top) or presence (bottom) of BLOC-1. No protein was bound to nanotubes lacking negatively charged lipids (arrowheads). (F and G) Cryo-EM image of BLOC-1 bound to GalCer/EPC/PI3P (F) or GalCer/EPC/PI4P (G) nanotubes (arrowheads). (H) Magnified region of G showing dark-dotted densities corresponding to BLOC-1 bound to a PI4P+ nanotube (arrowheads). (I) Cryo-EM image of a suspension of EPC/PS/PI4P vesicles and tubes incubated with BLOC-1. BLOC-1 binds to tubules (white arrowheads), but not to large vesicles (black arrowheads). Inset is the magnified boxed region. (J) Representative fluorescence images of EPC GUVs doped (bottom) or not (top) with PI3P after incubation for 30 min with BLOC-1. Membrane tubules (arrowheads) were observed in PI3P+ GUVs. (K) Cryo-EM image of tubules with non-constant diameters generated from PI4P+ GUVs upon addition of BLOC-1 (arrowheads; see also Fig. 2 G). Figures are representative of at least three independent experiments. In A, asterisk indicates a cleaved form of Dysbindin-GST in sample preparation. In E and I, asterisks indicate the carbon network of the grid. Scale bars: D–I and K, 25 nm; J, 5 µm. Source data are available for this figure: SourceData FS2.

