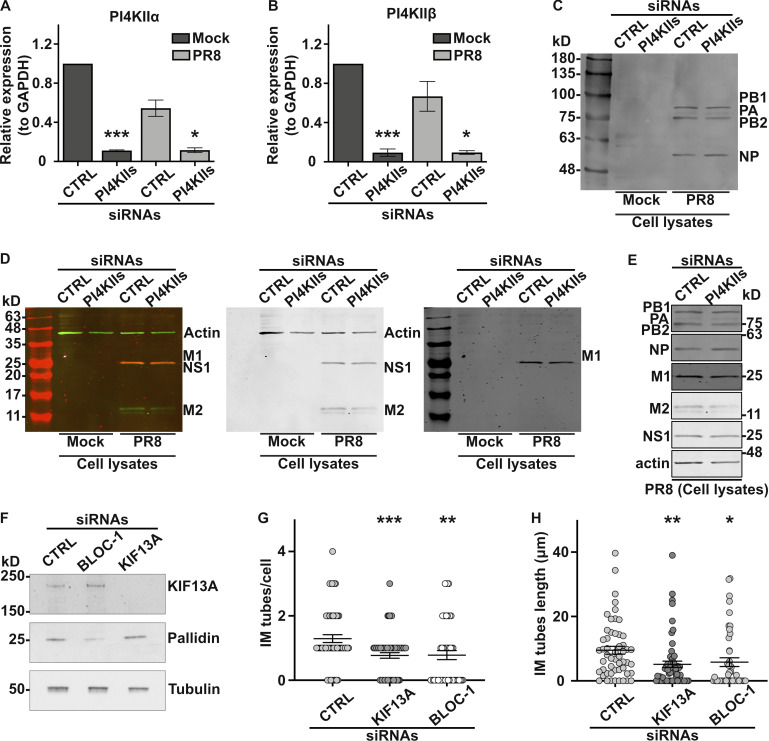
Figure S6.
PI4KIIs, BLOC-1, and/or KIF13A expression is required for viral or bacterial infection. (A–D) A549 cells treated with control (CTRL) or PI4KIIs siRNAs for 48 h were mock-infected or infected 8 h with PR8 virus at MOI of 3. (A and B) mRNA expression levels of PI4KIIα or PI4KIIβ relative to GAPDH levels. (C and D) Immunoblot analyses of cells lysates show expression levels of viral proteins PB1 (86.5 kD), PB2 (85.7 kD), PA (84.2 kD), and NP (56.1 kD; C), or M1 (27.8 kD; red in left panel, black in right panel), NS1 (26.8 kD; green in left panel, black in middle panel), M2 (11 kD; green in left panel, black in middle panel), and actin as a loading control (42 kD; green in left panel, black in middle panel; D). (E) Immunoblots cropped from C and D showing viral protein expression in lysates of siCTRL or siPI4KIIs-treated PR8-infected cells using antibodies against indicated proteins. (F) Immunoblotting of siCTRL, siBLOC-1, or siKIF13A-treated HeLa cell lysates probed for KIF13A (top), pallidin subunit of BLOC-1 (middle) and β-tubulin as a loading control (bottom). (G and H) HeLa cells treated with siCTRL, siKIF13A, or si-BLOC-1 were infected 12 h with Ctr D, and analyzed by IFM for Cap1 to quantify the average number/cell (G) and length (H) of Cap1+ tubules emanating from bacterial inclusions. (A and B) One-way ANOVA followed by Dunn’s multiple comparisons test (*, P < 0.05; ***, P < 0.001; n = 7 independent experiments). (G and H) Data from three independent experiments are presented as the mean ± SEM; two-tailed unpaired t test. *, P < 0.05; **, P < 0.01; ***, P < 0.001. Source data are available for this figure: SourceData FS6.

