FIGURE 2.

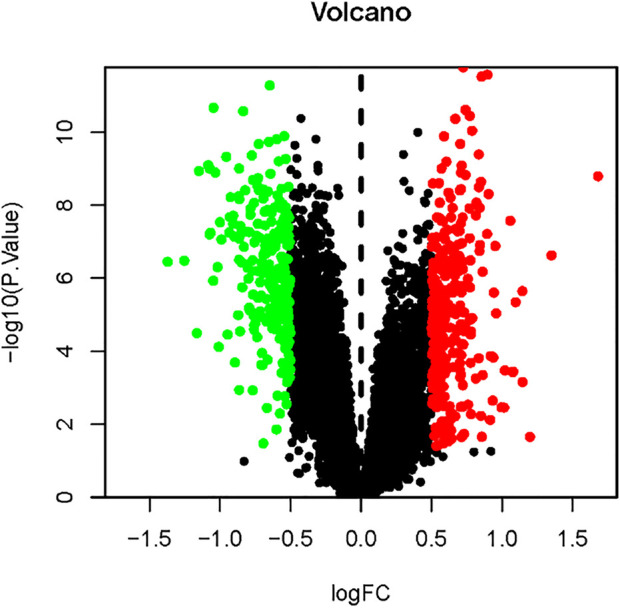
Volcano map of differential gene expression. Upregulated genes are indicated in red, downregulated genes are indicated in green, and black represents genes with no significant changes.

Volcano map of differential gene expression. Upregulated genes are indicated in red, downregulated genes are indicated in green, and black represents genes with no significant changes.