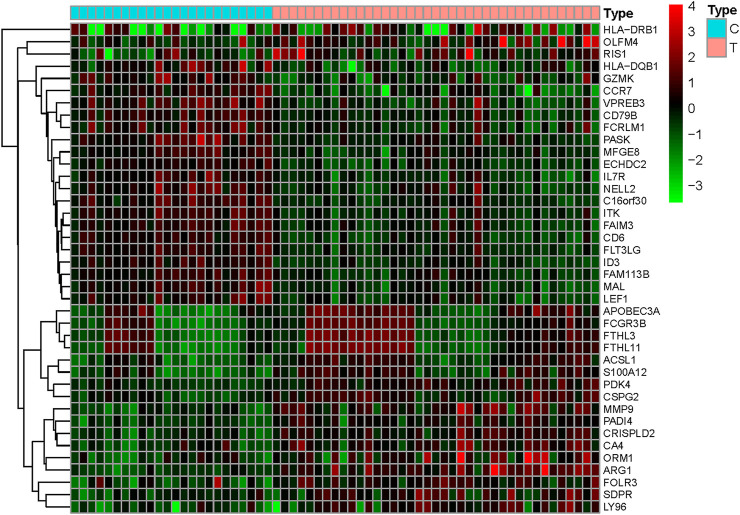
FIGURE 3.
Gene heat map. Upregulated genes are indicated in red (logFC > 0) in the genome, downregulated genes are indicated in green (logFC < 0) in the genome, and black represents genes that do not have significant differences. The first 24 samples came from the control group, and the last 39 samples came from the stroke group.

