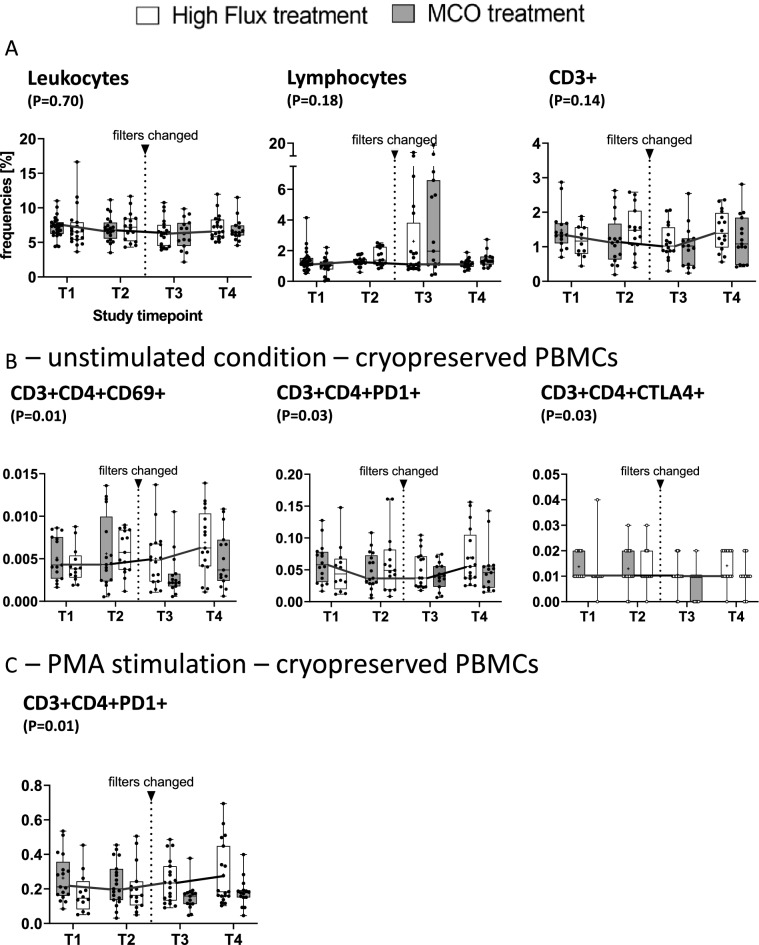
Figure 4.
(A–C) Report mean and 95% CI intervals for leukocytes, lymphocytes and CD3+ cells as reported above stratified by timepoint and treatment (MCO vs. high flux dialysis). P values were obtained from linear mixed effect models with subject ID (nested in sequence) with treatment (MCO = 1), period and sequence as main effects. A P values of < 0.05 was considered statistically significant. For CD3+ cells as well as (B) and (C) flow cytometric analysis was performed on re-thawed cryopreserved PBMCs which had been collected before the dialysis session (0 h) at all four study visits. Cells were then either left untreated (B) or stimulated with PMA + Ionomycin (C)—viability was generally > 85%. Means and SD can be obtained from Table 4. For details with regards to the gating strategy see supplement.

