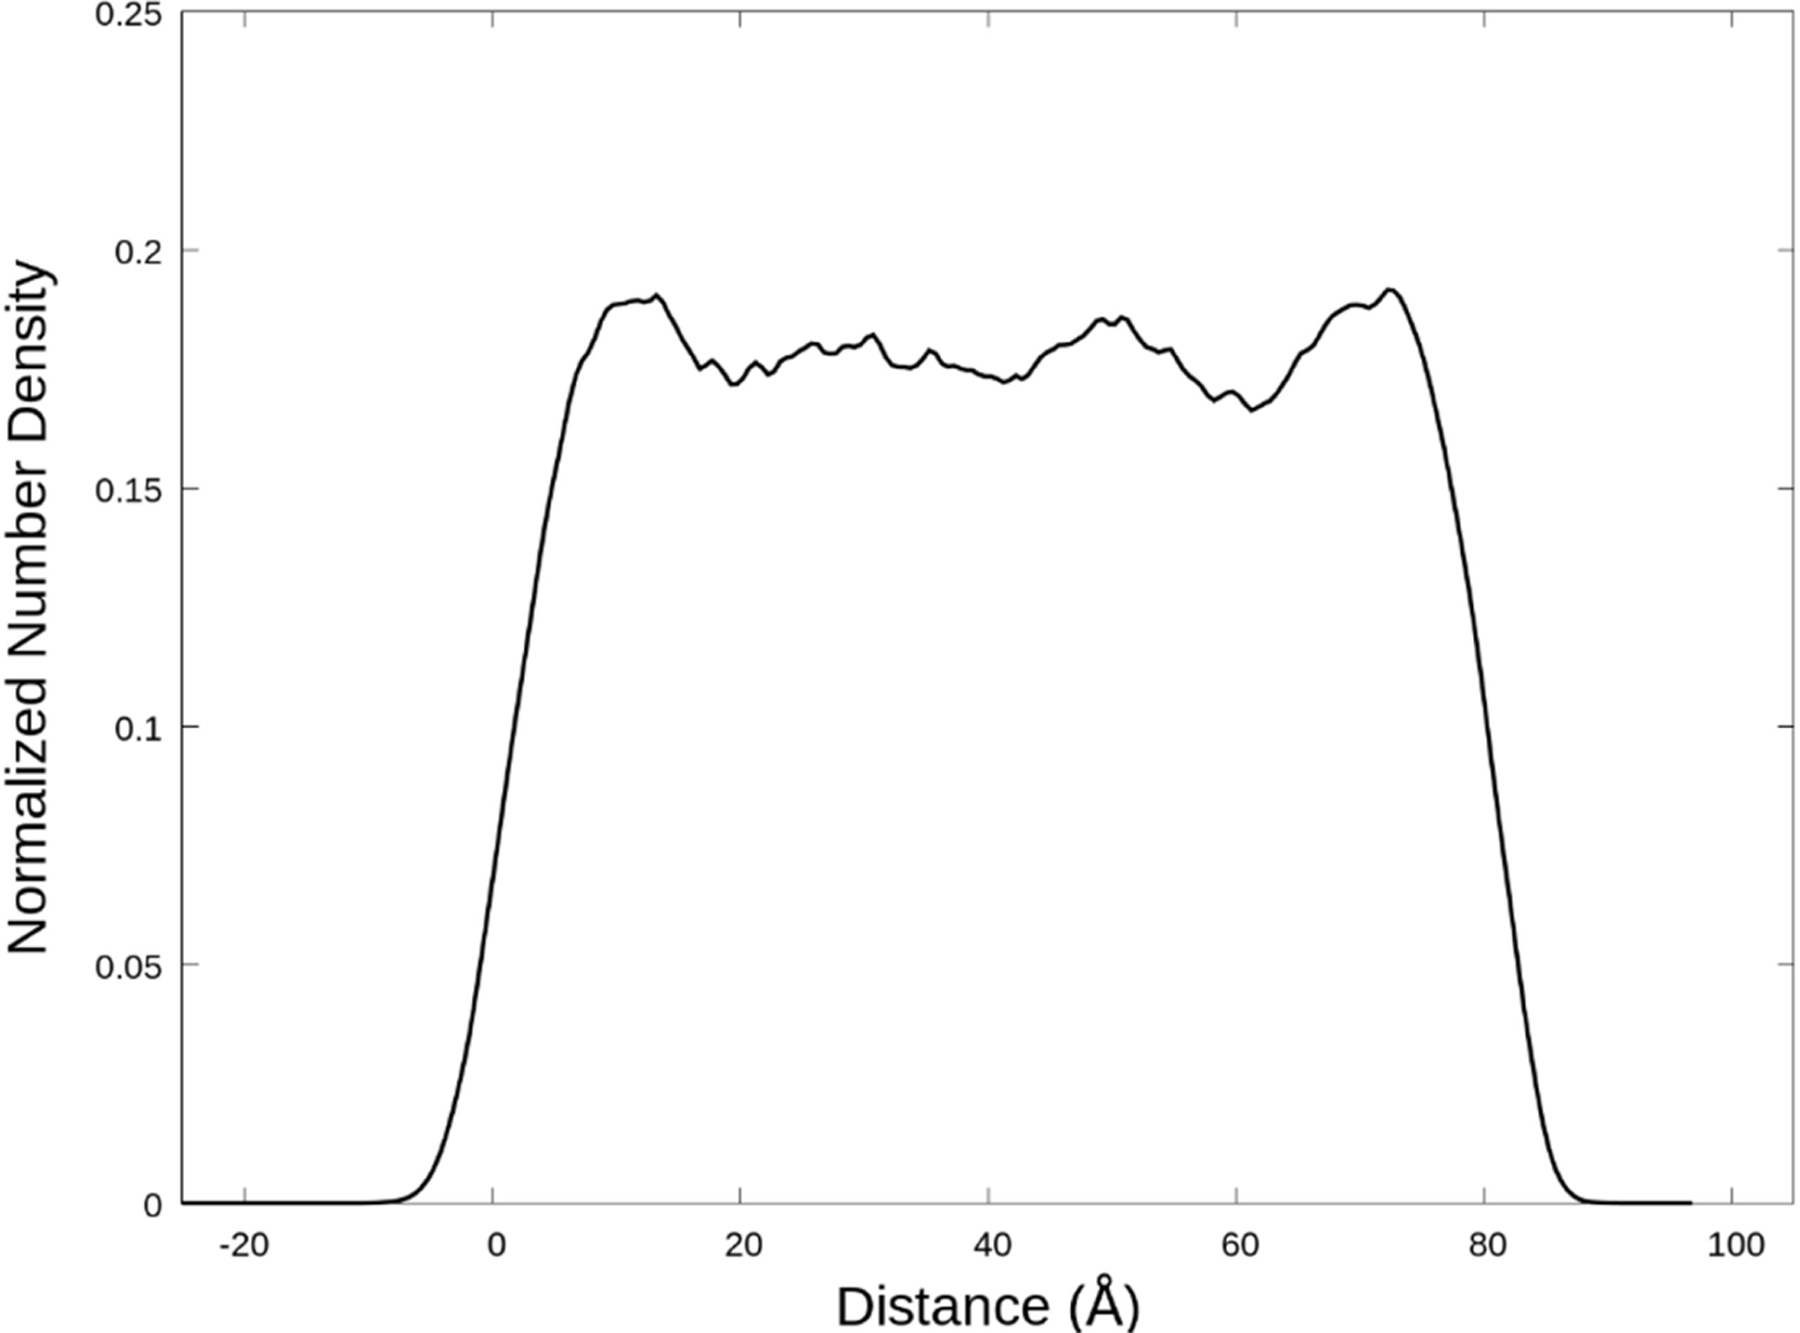
Fig. 5:

The total normalized number density profile perpendicular to the interface of a pure CAGE solution. The zero distance is selected to be the left Gibbs dividing surface of the slab. The vapor region isn’t entirely shown, so that the features of the liquid and interfacial regions are clearer. The shown data is from the simulation at 298 K, but other simulations were qualitatively similar.
