
Figure 1. Baseline Pediatric Overall Performance Category (POPC) and Pediatric Cerebral Performance Category (PCPC) Scores by presence and timing of neurologic dysfunction.
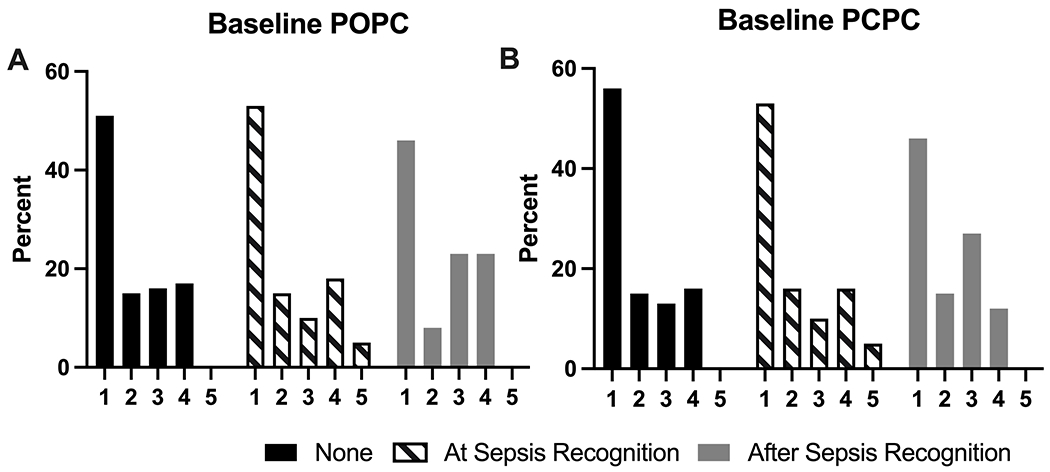
The distribution of POPC scores was different between the three groups (p=0.03, Fisher’s exact test), but there was no difference in the distribution when comparing neurologic dysfunction by timing of onset (p=0.38, Fisher’s exact test). The difference in PCPC score distribution was not different between the three groups (p=0.05, Fischer’s exact test).