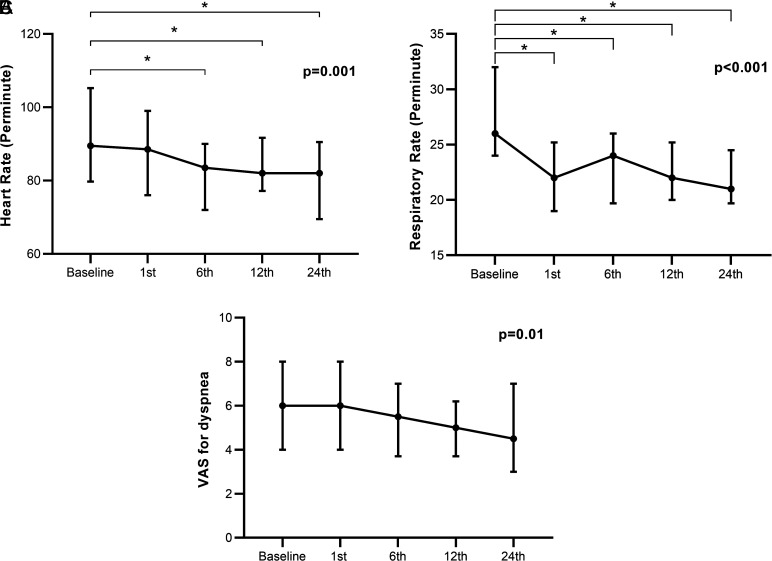
Figure 1.
Temporal changes in heart rate (A), respiratory rate (B), and Visual Analogue Scale for dyspnea (C) at baseline, 1st, 6th, 12th, and 24th hours. Data points represent medians with 25-75 percentiles, and P values were assessed by Friedman test. *P < .005 in pairwise analyses with Wilcoxon test.

 Content of this journal is licensed under a