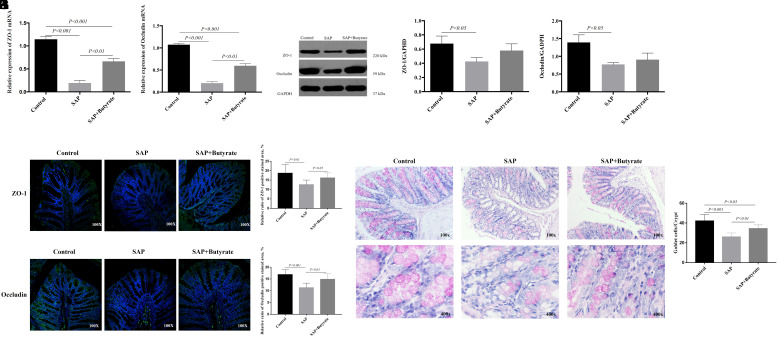
Figure 3.
The effect of butyrate on the expression of tight junction proteins in the colons. Control: Control group, SAP: SAP group, SAP + butyrate: SAP + butyrate group. (A) The mRNA expression of ZO-1 detected by RT-PCR. Control group versus SAP group: P < .001, Control group versus SAP + butyrate group: P < .001, SAP group versus SAP + butyrate group: P < .01. (B) The mRNA expression of occludin detected by RT-PCR. Control group versus SAP group: P < .001, Control group versus SAP + butyrate group: P < .001, SAP group versus SAP + butyrate group: P < .01. (C) ZO-1 and occludin level by Western blotting. (D) ZO-1 protein relative to GAPDH level. Control group versus SAP group: P < .05, Control group versus SAP + butyrate group: P > .05, SAP group versus SAP + butyrate group: P > .05. (E) Occludin protein relative to GAPDH level. Control group versus SAP group: P < .05, Control group versus SAP + butyrate group: P > .05, SAP group versus SAP + butyrate group: P > .05. (F) The immunofluorescence detection of ZO-1 in the colon tissues. Green particles represented the positive change. (G) The quantitative analysis of immunofluorescence detection of ZO-1 in the colon tissues. The quantitative analysis of immunofluorescence was by ImageJ software. Control group versus SAP group: P < .01, Control group versus SAP + butyrate group: P > .05, SAP group versus SAP + butyrate group: P < .05. (H) The immunofluorescence detection of occludin in the colon tissues. Green particles represented the positive change. (I) The quantitative analysis of immunofluorescence detection of occludin in the colon tissues. The quantitative analysis of immunofluorescence was by ImageJ software. Control group versus SAP group: P < .001, Control group versus SAP + butyrate group: P > .05, SAP group versus SAP + butyrate group: P < .01. (J) PAS staining of the colon tissues. Red particles represented the positive change. (K) Quantification of the PAS-postive cells in each group. Control group versus SAP group: P < .001, Control group versus SAP + butyrate group: P < .05, SAP group versus SAP + butyrate group: P < .01. n = 8 in each group. SAP, severe acute pancreatitis; RT-PCR, reverse transcription polymerase chain reaction; PAS, periodic acid Schiff.

 Content of this journal is licensed under a