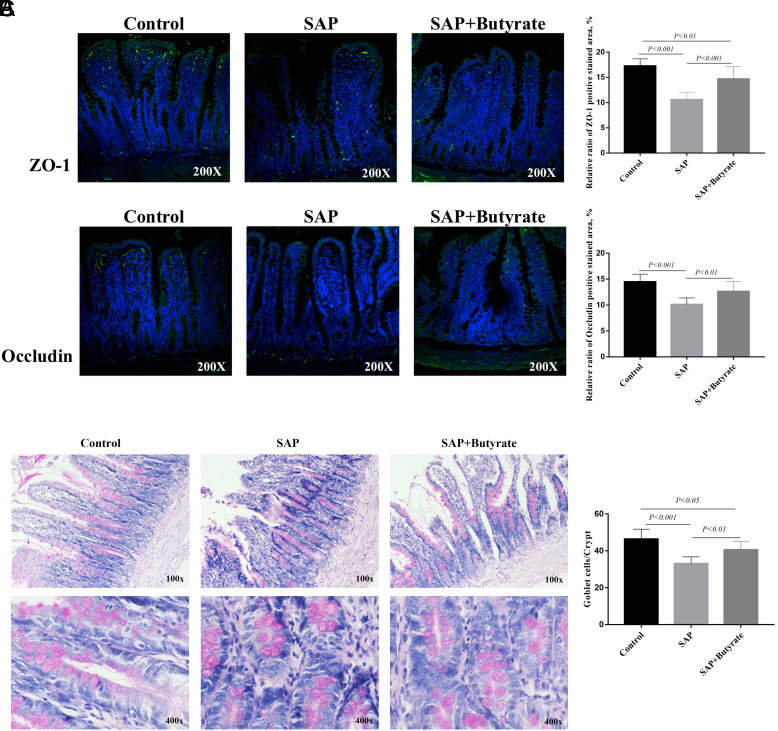
Supplementary Figure 2.
The effect of butyrate on the expression of tight junction proteins in the ileums. Control: Control group, SAP: SAP group, SAP + butyrate: SAP + butyrate group. (A) The immunofluorescence detection of ZO-1 in the ileum tissues. Green particles represented the positive change. The quantitative analysis of immunofluorescence was by ImageJ software. Control group versus SAP group: P < .001, Control group versus SAP + butyrate group: P < .01, SAP group versus SAP + butyrate group: P < .001. (B) The immunofluorescence detection of occludin in the ileum tissues. Green particles represented the positive change. The quantitative analysis of immunofluorescence was by ImageJ software. Control group versus SAP group: P < .001, Control group versus SAP + butyrate group: P > .05, SAP group versus SAP + butyrate group: P < .01. (C) PAS staining of the ileum tissues. Red particles represented the positive change. Control group versus SAP group: P < .001, Control group versus SAP + butyrate group: P < .05, SAP group versus SAP + butyrate group: P < .01. n = 8 in each group. SAP, severe acute pancreatitis.

 Content of this journal is licensed under a