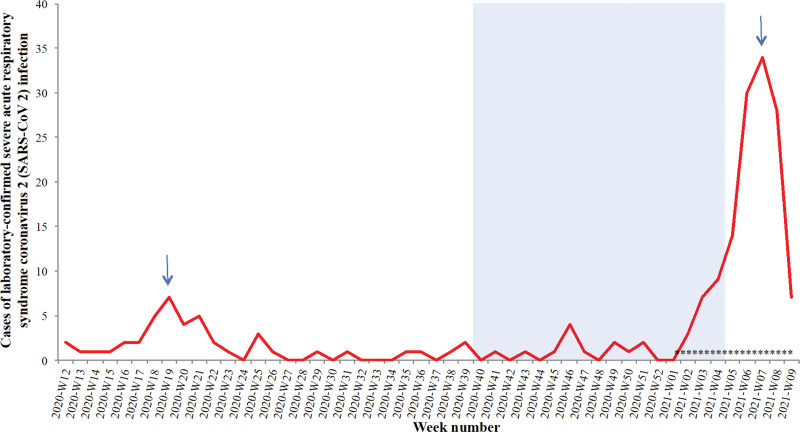
Figure 2.
Epidemic curve of laboratory confirmed severe acute respiratory syndrome coronavirus 2 during wave 1 and 2. Definition of waves according to ICU admission data. Blue area shows the weeks 40 to 4 excluded to avoid risk of overlap between wild-type and variant virus. Blue arrows show the peak of the two waves. *viral whole genome sequencing was performed for 23 critically ill patients: the majority (N = 20) had the 20H/501Y.V2 variant.

