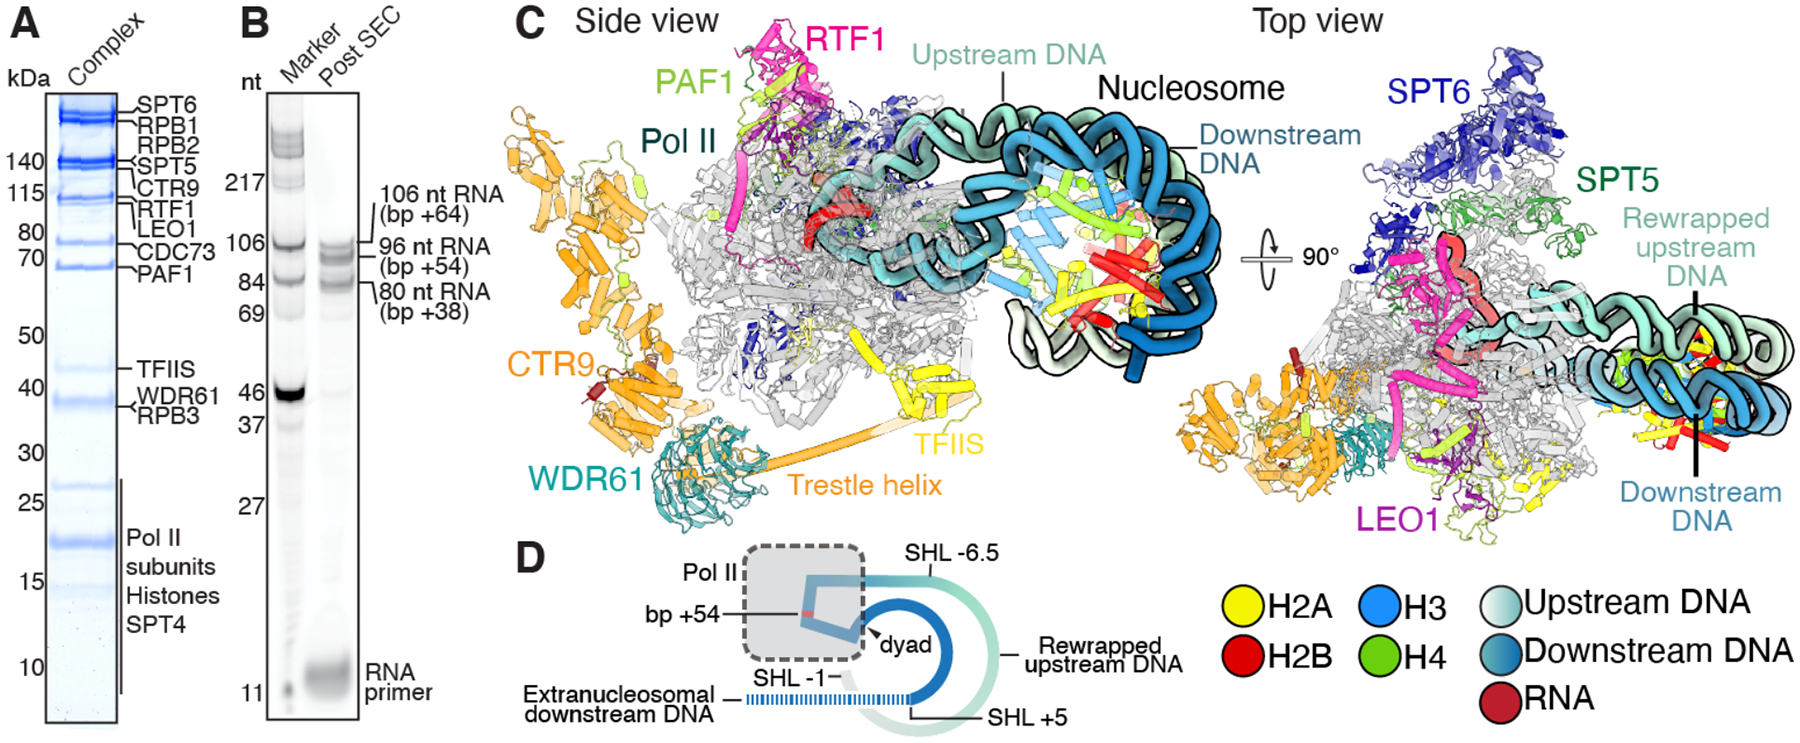
Fig. 1. Mammalian Pol II-DSIF-SPT6-PAF1c-TFIIS complex with rewrapped nucleosome.

(A) SDS-PAGE of peak fraction used for cryo-EM analysis shows assembly of Pol II-DSIF-SPT6-PAF1c-TFIIS-nucleosome complex. (B) Denaturing gel of purified complex shows primer extension and accumulation of the elongation complex at nucleosomal bp +38, +54, and +64. Stall sites within the nucleosome and corresponding RNA lengths are indicated. (C) Two views of the mammalian Pol II-DSIF-PAF1c-TFIIS-nucleosome complex with rewrapped transcribed DNA. The views are related by a 90° rotation. Pol II, SPT5, SPT6, CTR9, WDR61, PAF1, LEO1, CDC73, RTF1, TFIIS, H2A, H2B, H3, and H4, are shown in gray, forest green, dark blue, orange, teal, limon, purple, firebrick red, pink, yellow, light yellow, red, light blue, and chartreuse, respectively. DNA template is colored upstream to downstream as a gradient from white to blue. Colors used throughout. (D) Schematic of the complex. Unresolved downstream DNA is shown as a dotted line.
