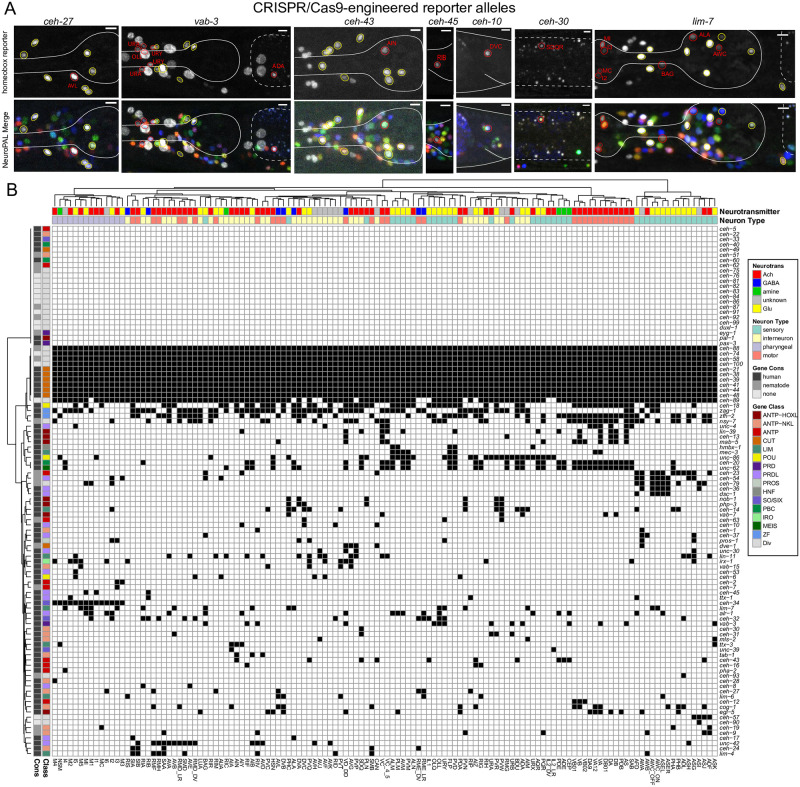
Fig 1. Updated expression of the homeobox gene family with reporter alleles.
Fig 1A: Representative images of homeobox reporter alleles, generated by CRISPR/Cas9 genome engineering (see strain list in S5 Table) with different expression than previously reported fosmid-based reporter transgenes. Neuron classes showing expression not previously noted were identified by overlap with the NeuroPAL landmark strain, and are outlined and labeled in red. Neuron types in agreement with previous reporter studies are outlined in yellow. Head structures including the pharynx were outlined in white for visualization. Autofluorescence common to gut tissue is outlined with a white dashed line. An n of 10 worms were analyzed for each reporter strain. Scale in bottom or top right of the figure represents 5 μm. See also S1 Fig for more information on ceh-30 and ceh-31. Fig 1B: Summary of expression of all homeobox genes across the C. elegans nervous system, taking into account new expression patterns from panel A and all previously published data [6]. Black boxes indicate that a homeodomain transcription factor is expressed in that given neuron type and white boxes indicate that a homeodomain transcription factor is not expressed in that given neuron type. Neuron types along the x axis are clustered by transcriptomic similarity using the Jaccard index (see methods) and homeobox genes along the y axis are clustered similarly by their similar expression profiles in shared neuron types. See S3 Fig for numerical representation of homeoboxes per neuron.

