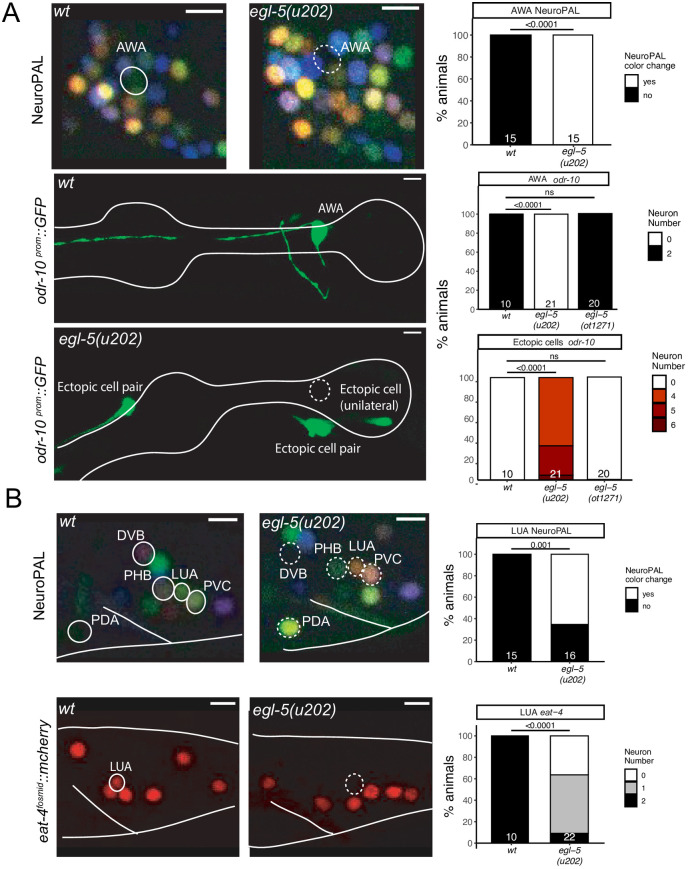
Fig 8. The HOX gene egl-5 affects the differentiation of head and tail neurons.
Fig 8A: egl-5(u202) mutant animals show a loss of AWA marker expression, including NeuroPAL (otIs669) and an odr-10 reporter transgene (kyIs37). Representative images of wildtype and mutant worms are shown with 5 μm scale bars. Graphs compare expression in wildtype and mutant worms with the number of animals examined listed at the bottom of the bar. P-values were calculated by Fisher’s exact test. Fig 8B: egl-5(u202) mutant animals show changes in tail marker expression, including NeuroPAL (otIs669) in PDA, LUA, PVC and loss of eat-4 (otIs518) expression in LUA. Representative images of wildtype and mutant worms are shown with 5 μm scale bars. Graphs compare expression in wildtype and mutant worms with the number of animals examined listed at the bottom of the bar. P-values were calculated by Fisher’s exact test. In all panels, neurons of interest are outlined in solid white when expressing wildtype reporter colors, and dashed white when one or all colors are lost.

