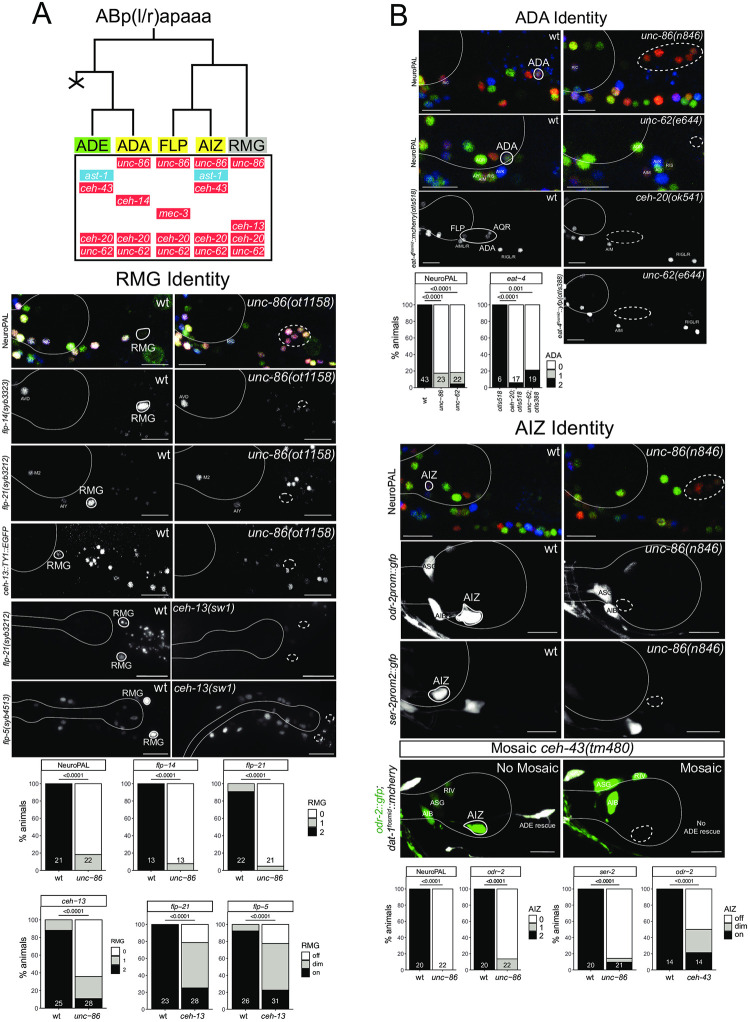
Fig 11. POU, MEIS and HOX genes control neuron identity in the anterior deirid lineage.
Fig 11A: Lineage diagram depicting the generation of the anterior deirid neurons. Shown below each neuron in the lineage are the transcription factors known to be expressed in each of the respective neurons. Expression patterns for homeodomain proteins (all except AST-1) in the lineage are from [6, 91] and AST-1 is from this paper (S6 Fig). Green shading: dopaminergic neuron; yellow shading: glutamatergic neuron, grey shading: peptidergic neuron, red shading: homeobox gene, blue shading: non-homeobox gene. Fig 11B: Marker analysis in the anterior deirid lineage of wild-type and mutant animals. ADA Identity: unc-62(e644) and unc-86(n846) mutant animals show a loss of NeuroPAL (otIs669) in ADA. Additionally, unc-86(n846) mutant animals show a loss of an eat-4 fosmid reporter (otIs518) in ADA. Representative images of wild type and mutant worms are shown with 10 μm scale bars. Graphs compare expression in wild type and mutant worms with the number of animals examined listed at the bottom of the bar. P-values were calculated by Fisher’s exact test. With two different eat-4 fosmid based reporters, unc-62 and ceh-20 mutants also show differentiation defects in other neurons in the location of the anterior deirid, besides ADA (namely, FLP and AQR neurons). RMG Identity: unc-86(ot1158) mutant animals show a loss of RMG marker expression, including NeuroPAL (otIs669), a flp-14 CRISPR reporter (syb3323), a flp-21 CRISPR reporter (syb3212), and a ceh-13 fosmid reporter (wgIs756). ceh-13(sw1) mutant animals show defects in the expression of two CRISPR reporters, flp-5(syb3212) and flp-5(4513), in RMG. Representative images of wild type and mutant worms are shown with 10 μm scale bars. Graphs compare expression in wild type and mutant worms with the number of animals examined listed at the bottom of the bar. P-values were calculated by Fisher’s exact test. AIZ Identity: unc-86(n846) mutant animals show a loss of expression of NeuroPAL (otIs669) and an odr-2 reporter transgene (kyIs51) and defects in the expression of a ser-2 reporter transgene (otIs358) in AIZ. Representative images of wild type and mutant worms are shown with 10 μm scale bars. Graphs for NeuroPAL and odr-2 compare expression in wild type and mutant worms with the number of animals examined listed at the bottom of the bar. Graphs for ser-2 compare the brightness of expression (on, dim, off) in wild type and mutant worms with the number of animals examined listed at the bottom of the bar. In all panels, neurons of interest are outlined in solid white when expressing wildtype reporter colors, and dashed white when one or all colors are lost. P-values were calculated by Fisher’s exact test.

