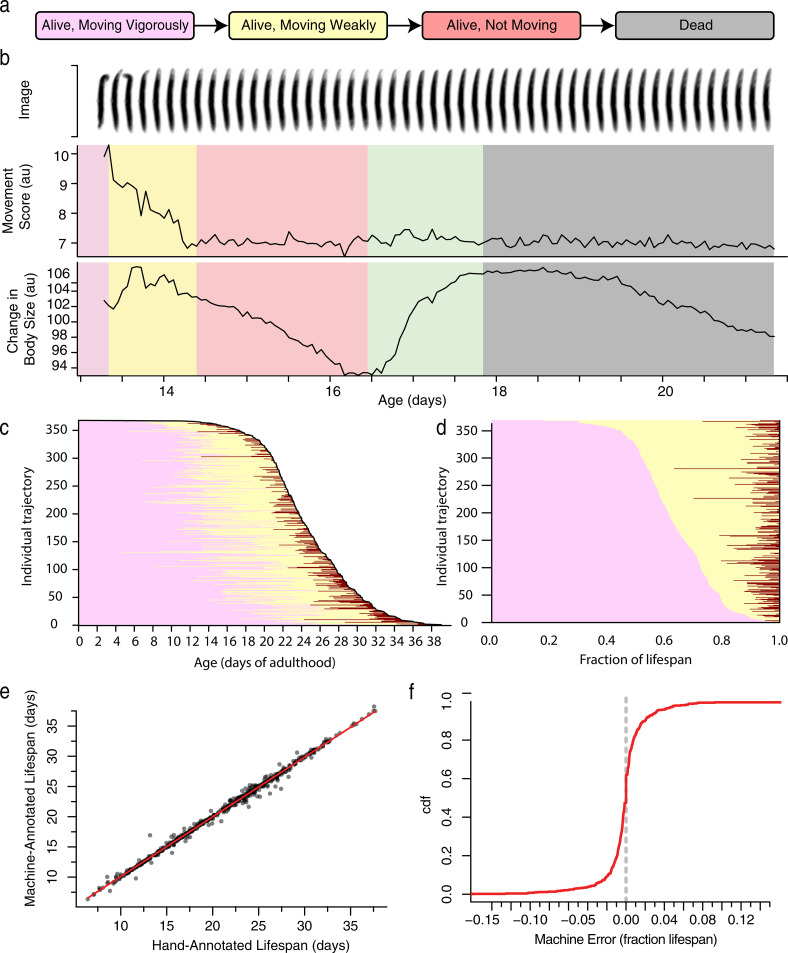
Fig 1. Automated, high-throughput phenotyping.
a. A coarse classification scheme for behavioral aging and death involving four states. b. The last few days of an individual’s life involve a set of stereotyped movement and morphological transitions. After a week or more of vigorous movement (purple), individuals slow down and exhibit only weak postural changes (yellow) until eventually ceasing all movement (red). Meanwhile, their apparent body size decreases until the time of death at which point it increases rapidly (green), plateaus, and then decreases again (gray). c. In a population of 368 wild-type animals, the times spent moving vigorously (pink), moving weakly (yellow), and non-moving (red), were annotated by hand and plotted. Each horizontal line represents a single individual, with individuals ordered vertically according to their death time. d. The same lifespan data is plotted with state occupancy times represented as fractions of lifespan, with individuals ordered vertically by the duration of vigorous movement. e. The performance of automated lifespan analysis using body size expansion as a marker for death. A Hidden Markov Model (HMM) was fit to 830 wild-type individuals housed in a variety of environmental conditions, with the population subdivided according to biological replicate and tested in a 6-fold cross-validation approach. By-hand annotated death times were compared to the death times identified by the HMM, shown both in respect to absolute time and f. as a cumulative distribution function (CDF) of the difference between by hand and automated measurements as a fraction of lifespan.

