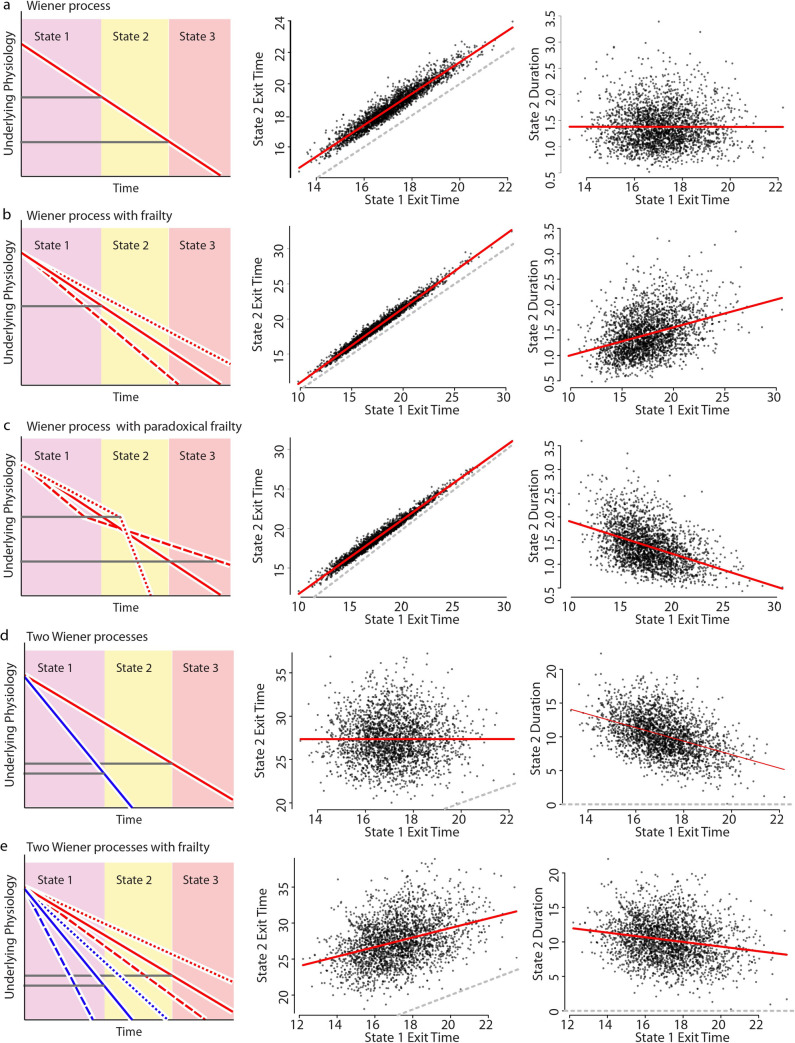
Fig 4. Stochastic models of aging link VMC and death times.
To explain our experimental data, we performed a series of stochastic simulations involving one or two biased random walks (Weiner processes; see statistical methods). The simulation generates transition times for a set of individuals between three states, with state 1 exit corresponding to the vigorous movement cessation (VMC) observed experimentally and state 2 exit corresponding to death. Each row explores a different set of assumptions about the relationship between these state transitions, as diagrammed in the left column. Simulation results are summarized by comparing the timing of each individual’s exit from states 1 and 2 (middle column) with the linear regression (red) and x = y unity lines overlaid. Simulation results are further summarized by comparing each individuals’ state 1 exit time to duration they spent in state 2 (right column), with the linear regression line overlaid (red). This latter duration corresponds to the lifespan remaining after VMC as observed experimentally. a. A single process model in which state transition times are determined by the sequential crossing of two thresholds. b. A single process model as in a., but including population-heterogeneity (frailty) in individual aging rates. c. A single process model as in b., but including a paradoxical frailty effect in which the effect of population-heterogeneity instantaneously flips between states, such that the relative rate of aging is reversed between individuals when they exit state 1. d. A two process model in which the exit from states 1 and 2 are determined by distinct processes (red and blue). e. A two-process model like d. but including population-heterogeneity (frailty) in individual aging rates.

