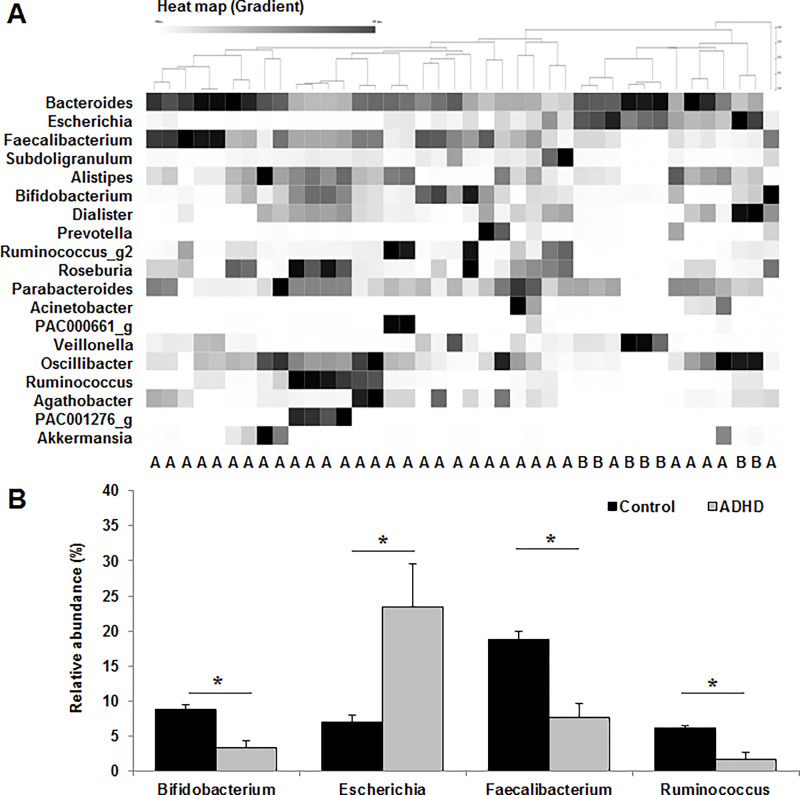
Fig 2. Comparison of the gut microbiota at the genus level between the control and attention deficit hyperactivity disorder (ADHD) groups.
(A) Heat map of different genera in the gut microbiota. A, control group; B, ADHD group. (B) Relative abundance of the gut microbiota. Values are expressed as the mean ± SEM. The statistical significance between the control and ADHD groups was analyzed by the Student’s t-test (*p < 0.05).

