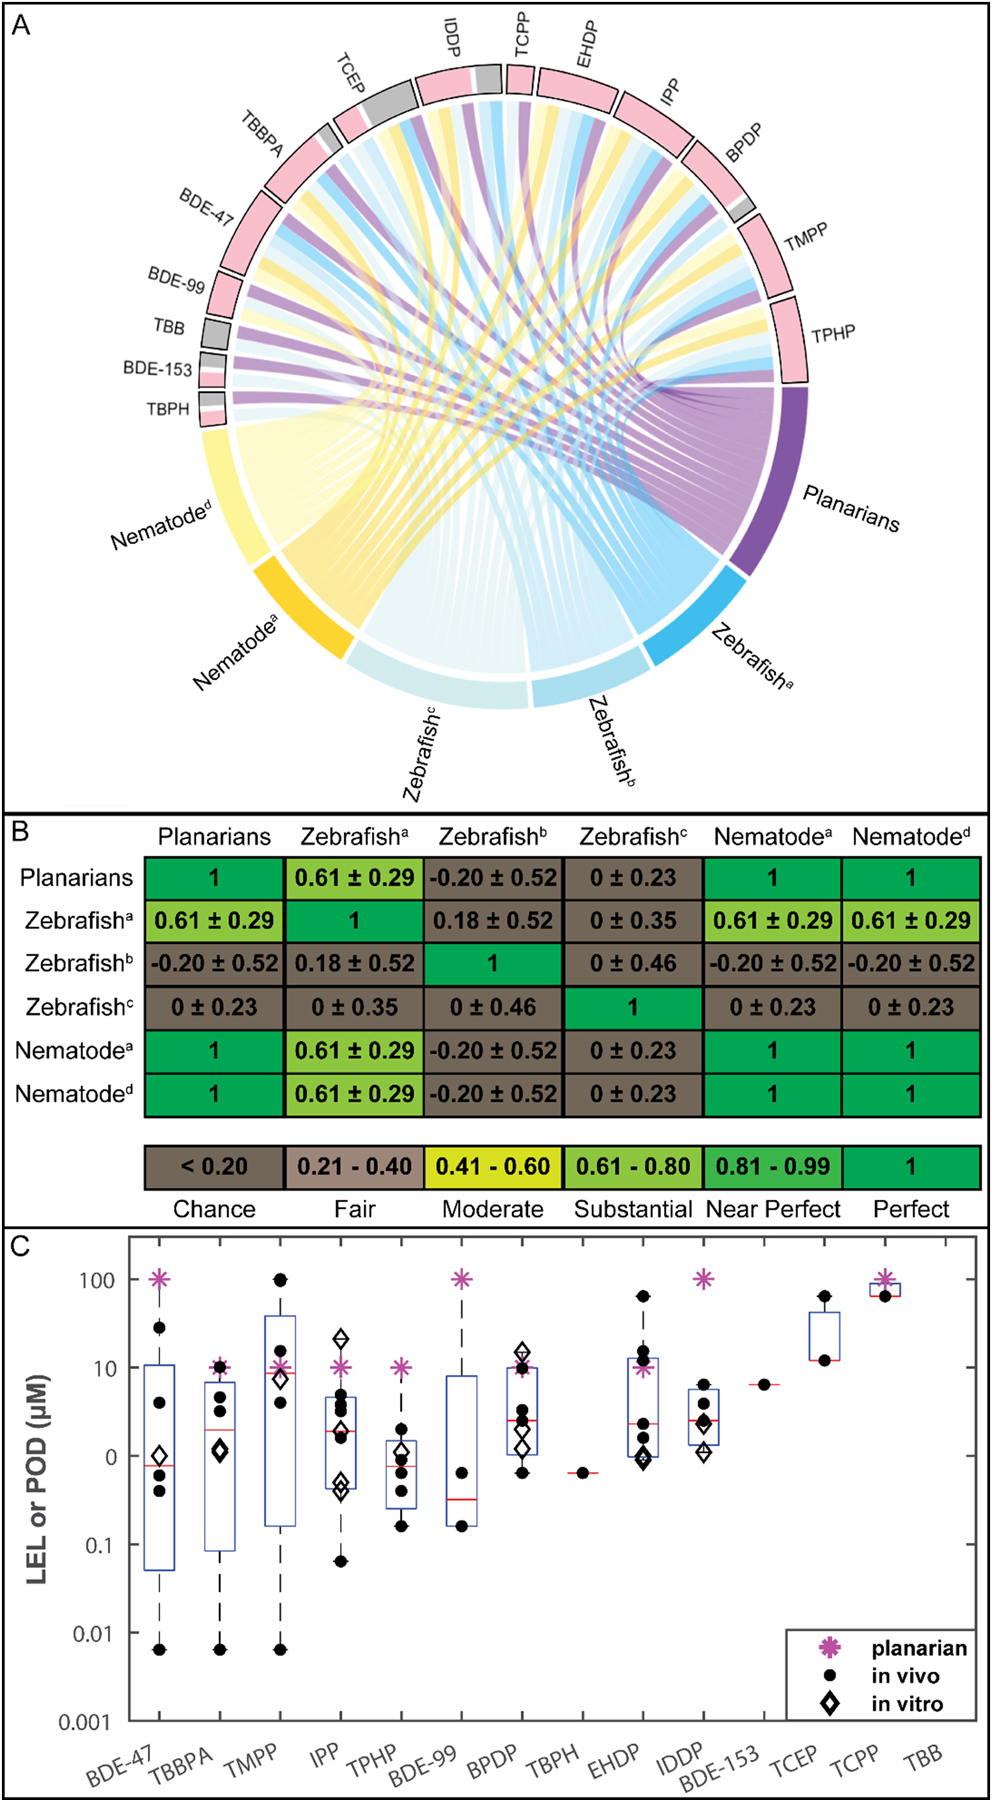
Figure 5.

Concordance between different alternative models. A. Interaction of bioactivity of the 14 flame retardants (FRs) with the different tested alternative animal models. Each box represents the interactions of this FR with the different models and studies. Active interactions are in pink. Inactive interactions are in grey. FRs with both active and inactive interactions showed different effects in different studies/models. B. Quantification of concordance between alternative animal models for 9 FRs screened in all alternative animal models using Cohen’s kappa (κ), listed as κ ± 95% confidence intervals (McHugh, 2012). the Noyes et al. study showed a kappa of 0 for all comparisons because it had no inactives in this set of 9 FRs. For (A) and (B), studies are listed as: a, data from (Behl et al., 2015); b, data from (Jarema et al., 2015); c, data from (Noyes et al., 2015); d, data from (Behl et al., 2016). C. Comparison of toxicity potency of 14 FRs in regenerating planarians and other alternative developing models. The data for the individual studies are overlaid on a box and whisker plot compiling the lowest-effect-levels (LELs) and points-of-departure (PODs) for the different FRs in all compared models. Stars represent planarian LELs, filled dots represent LELs/PODs in developing zebrafish and nematode models (Behl et al., 2016, 2015; Jarema et al., 2015; Noyes et al., 2015), and diamonds represent PODs in in vitro cell-based models (Behl et al., 2015). The x-axis shows the FRs in decreasing order of potency (lowest effect concentration).
