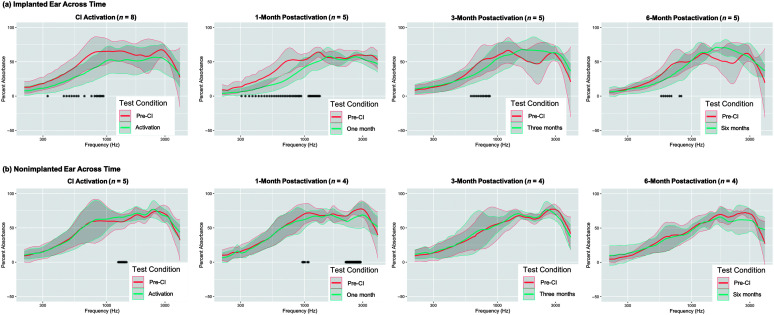
Figure 1.
Changes in acoustic absorbance in (a) implanted and (b) nonimplanted ears pre- and postsurgery. Line plots showing acoustic absorbance from 0.2 to 4 kHz (the spectral range investigated in this study) for ears at the pre-CI baseline time point (salmon) and at each post-CI time point (teal). The number of participants included at each time point is shown in the title of each panel. Differences in the numbers of participants between implanted and nonimplanted ears are due to the exclusion of bilateral CI recipients from nonimplanted ear analyses (n = 2 participants) and due to time limitations precluding testing of acoustic absorbance in the nonimplanted ear at the 6-month postactivation time point (n = 1 participant). Bold lines represent the group mean, and the gray shaded region represents ±1 SD. Asterisks along the x-axis indicate frequencies where statistically significant differences in acoustic absorbance were observed at the p < .05 significance level based on nonparametric 95% confidence intervals of median acoustic absorbance difference scores. CI = cochlear implant.

