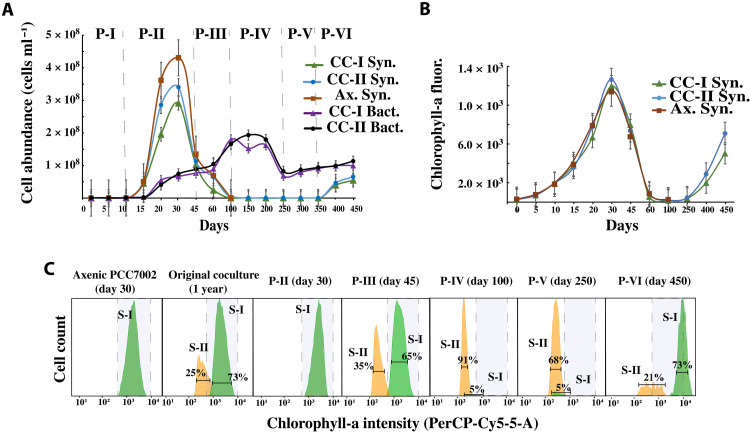
Fig. 2. Growth of Synechococcus and heterotrophic bacteria within the coculture system.
(A) Flow cytometric measurement showing Synechococcus and heterotrophic bacterial cell abundance over the 450 days of coculture period. Cocultures I and II are replicate culture systems. Each data point is an average of two replicates. The vertical dotted line approximately demarcates the start of each of the observed phases (P-I to P-VI). (B) Chlorophyll-a fluorescence, as an indicator of Synechococcus growth, was measured at 440/680 nm. Each data point is an average of three replicates. (C) Histogram showing the intensity of chlorophyll-a of the two subpopulations (S-I and S-II) related to Synechococcus sp. PCC7002. The error bars in each plot indicate the standard error of the mean. CC-I Syn., Synechococcus sp. PCC7002 abundance in coculture-I; CC-II Syn., Synechococcus sp. PCC7002 abundance in coculture II; Ax. Syn., Synechococcus sp. PCC7002 abundance in axenic culture; CC-I Bact., heterotrophic bacterial abundance in coculture I; CC-II Bact., heterotrophic bacterial abundance in coculture II.

