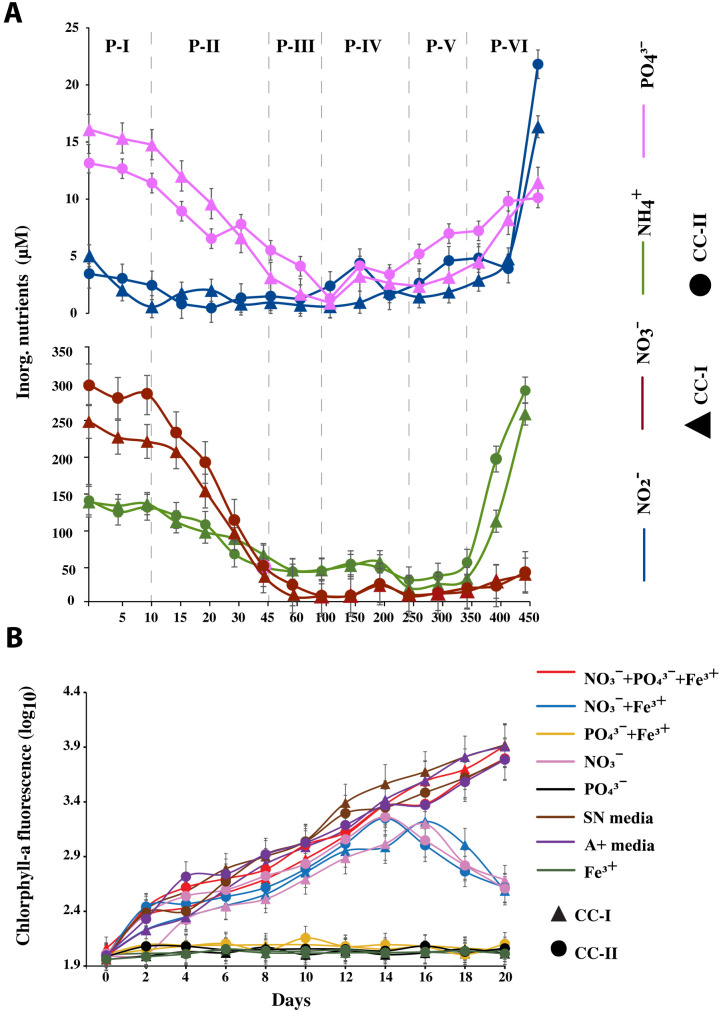
Fig. 3. Nutrient concentration and key nutrients that limited Synechococcus growth within the coculture system.
(A) Changes in the concentration of inorganic nutrients (NO2−, NO3−, NH4+, and PO43−) during different phases of Synechococcus growth. Each data point is an average of two replicates. (B) Effect of exogenous inorganic nutrients on the chlorotic Synechococcus cells. Synechococcus growth was determined as a measure of chlorophyll-a fluorescence. Each data point is an average of three replicates. Error bars in each plot depict the standard error of the mean. CC-I, coculture I; CC-II, coculture II.

