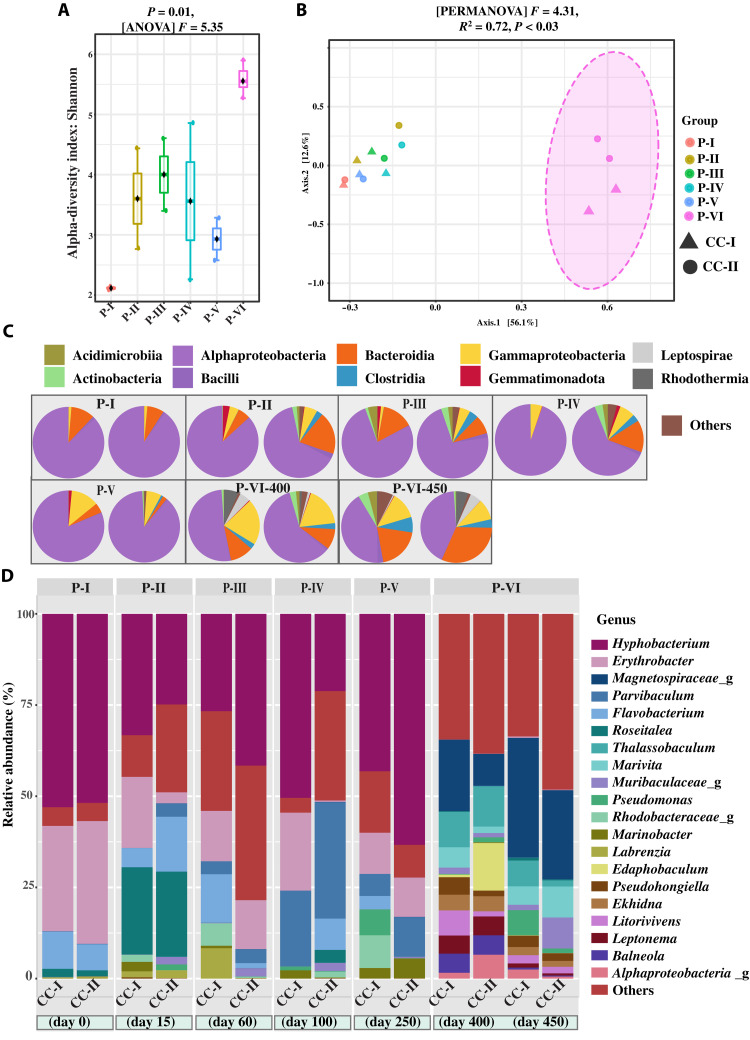
Fig. 4. Changes in the composition of the heterotrophic bacterial community as revealed by 16S rRNA gene amplicon sequencing.
(A) Box plots illustrating the alpha diversity (Shannon diversity index) for samples at different phases (P = 0.01, F = 5.35). (B) PCoA of heterotrophic bacterial communities in different phases: PERMANOVA: F = 4.3125; R2 = 0.72939; P < 0.003. Ordination method: PCoA, distance method: Bray-Curtis, taxonomic level: ASV, statistical method: PERMANOVA. (C) The relative abundance of 16S rRNA gene amplicon sequences assigned to the top 10 most abundant bacterial classes. (D) The relative abundance of 16S rRNA gene amplicon sequences assigned to the top 20 most abundant bacterial genera. CC-I, coculture I; CC-II, coculture II.

