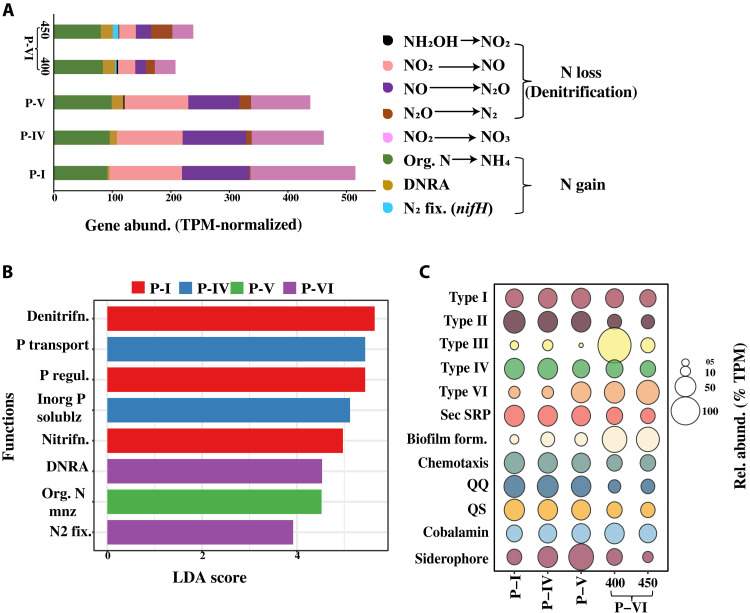
Fig. 5. Comparative analysis of the functional capability of the heterotrophic bacteria at different phases.
(A) Gene abundance (TPM-normalized) of all detected genes from the nitrogen cycle across the analyzed metagenomic samples. (B) LDA plot showing logarithmic LDA score (effect size) of the most significant (false discovery rate adjusted P value of 0.01, log LDR score of 2) genes involved in the nitrogen and phosphorus cycles across the analyzed metagenomic samples. Group P-VI includes samples from days 400 and 450. (C) Bubble plot showing the relative abundance (TPM-normalized) of other functional genes [bacterial secretory systems, biofilm formation, chemotaxis, QS-QQ, cobalamin (vitamin B12), and Fe siderophore synthesis] across the analyzed metagenomic samples.

