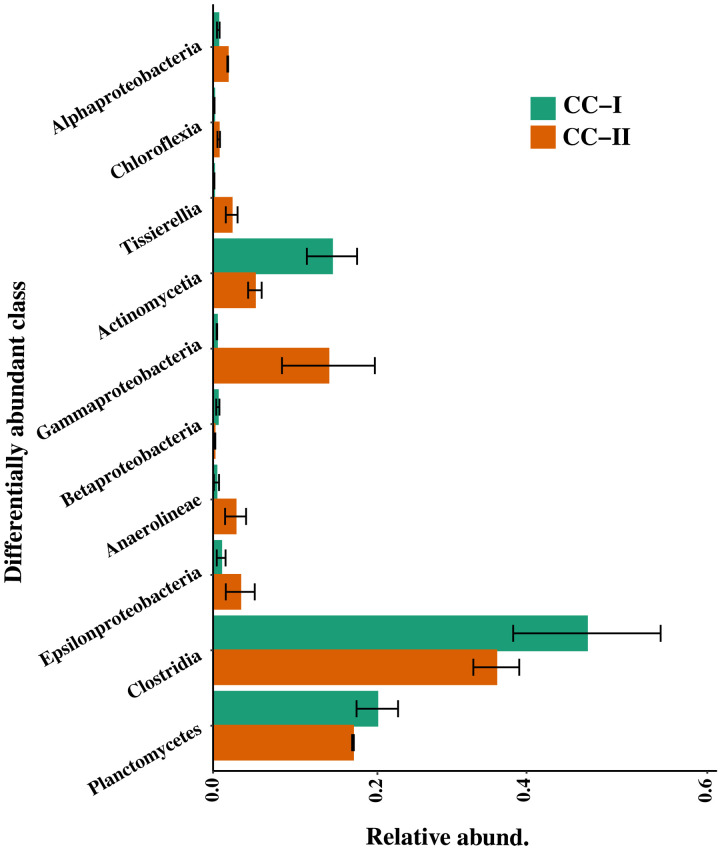
Fig. 8. Relative abundance of differentially abundant classes showing nifH expression at P-VI.
Differentially abundant classes were identified by multivariate statistical analysis of Metastat (P = 0.05). Error bars in each plot depict the standard error of the mean. CC-I, coculture I; CC-II, coculture II.

