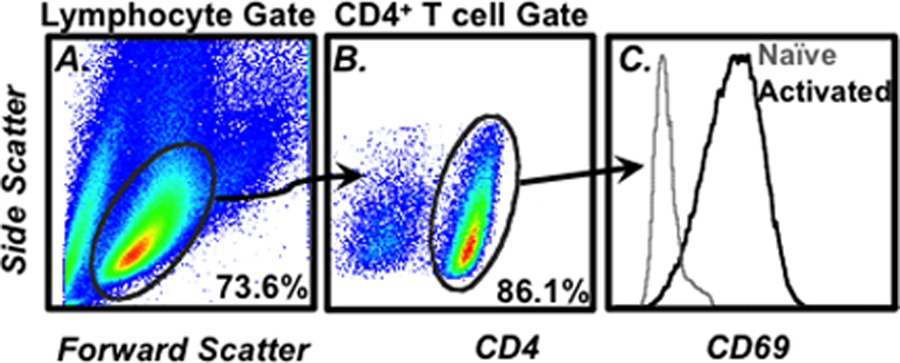
Fig. 1.

Example of flow cytometry gating strategy. (a) The cell size (forward scatter) vs. cell granularity (side scatter) is plotted on a 2D density plot. The lymphocytes can be identified by characteristic size and scatter profiles and then gated on for further analysis. (b) To identify CD4+ T cells in the gated lymphocytes, a 2D density plot of CD4 expression vs. side scatter is prepared. The CD4+ cells can then be gated upon for additional analysis such as (c) CD69 surface expression. The numbers in A and B represent the frequency of cells within the indicated gate
