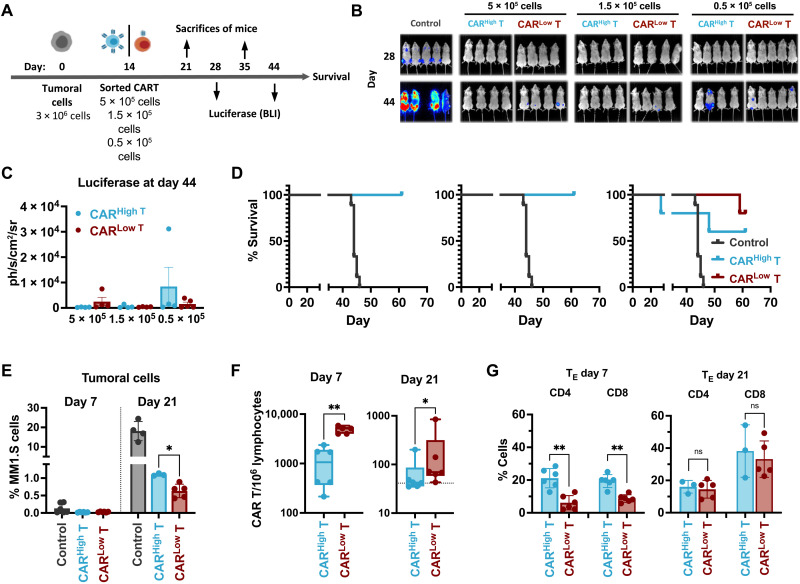
Fig. 2. In vivo antitumoral efficacy of CAR T cells with different CAR densities.
(A) Schematic representation of the experimental procedure. NGS mice were injected intravenously on day 0 with 3 × 10⁶ MM1.S-GFPLuc cells per animal. After 14 days, 5 × 10⁵, 1.5 × 10⁵, or 0.5 × 10⁵ of CARHigh T or CARLow T cells were injected intravenously. Bioluminiscence analysis (BLI) was performed on days 28 and 44. Animal survival was monitored until the end of the experiment (day 67). On days 21 (7 days after CAR T administration) and 35 (21 days after CAR T administration), a subset of animals was sacrificed to analyze the presence of tumor and CAR T cells. (B) BLI images at the indicated days of control mice (n = 5) or treated with CARHigh T cells (n = 4 to 5) or CARLow T cells (n = 4 to 5). (C) Quantification of BLI (photons/s/cm2/sr) in the different group of animals as a measurement of tumor growth. (D) Survival of control mice (n = 5) or treated with CARHigh T cells (n = 4 to 5) or CARLow T cells (n = 4 to 5) at the indicated doses. (E) Quantification of the tumor cells present in the BM of control mice (n = 4) or treated with CARHigh T cells (n = 5) or CARLow T cells (n = 5) at days 7 and 21 after CAR T cell administration. (F) Quantification of the CAR T cells present in the BM of animals treated with CARHigh T cells (n = 6) or CARLow T cells (n = 6) at days 7 and 21 after CAR T cell administration. (G) Analysis of the phenotype of CARHigh T and CARLow T cell populations at days 7 and 21 after CAR T cells administration. Mean ± SEM of TE cell subpopulation within CD4+ and CD8+ subset of CARHigh T and CARLow T cells is depicted. Mantel-Cox (log-rank) test (D), Kruskal-Wallis test (E), Mann-Whitney test (F), and two-way ANOVA with Sidak’s multiple comparison (G). *P < 0.05 and **P < 0.01.

