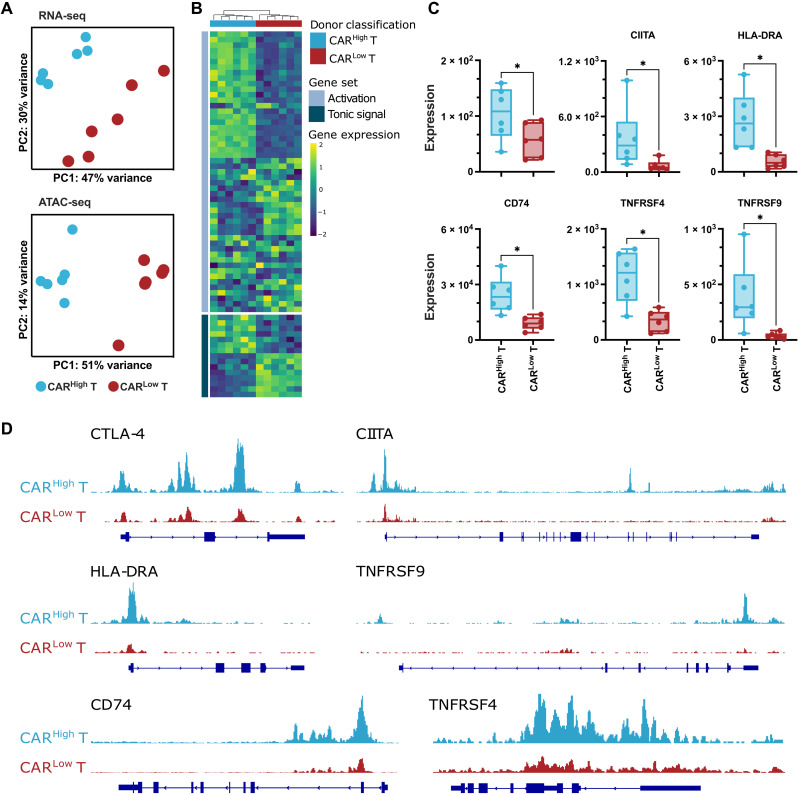
Fig. 3. Transcriptomic profile and chromatin landscape of CD8+ CARHigh T cells.
The transcriptomic and epigenetic landscape of sorted CD8+ and CD4+ (see fig. S8) CARHigh T and CARLow T cells (n = 6) was profiled using high-throughput RNA-seq and ATAC-seq. (A) RNA-seq and ATAC-seq principal components (PC) analysis, corrected by patient heterogeneity, of sorted CD8+ CAR T cell subsets. Percentage of variance explained by PC1 and PC2 is depicted. (B) Heatmap of DEGs between CD8+ CARHigh T and CARLow T cells associated to genes involved in tonic signaling and T cell activation. (C) Quantification of CTLA-4, CIITA, HLA-DRA, CD74, TNFRSF4 (OX40), and TNFRSF9 (4-1BB) gene expression in CD8+ CARHigh T and CARLow T cells. (D) UCSC genome browser tracks of CTLA-4, CIITA, HLA-DRA, TNFRSF9, CD74, and TNFRSF4 showing differential peaks from ATAC-seq analysis between CD8+ CARHigh T and CARLow T cells. Wilcoxon test for paired samples (C). *P < 0.05.

