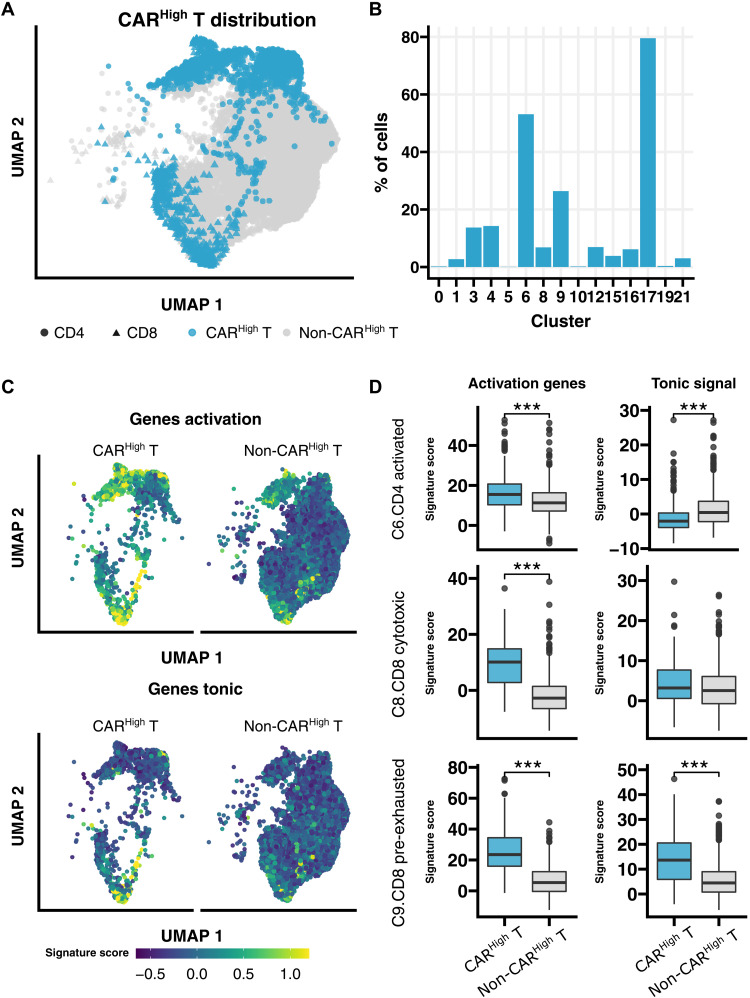
Fig. 5. Single-cell sequencing reveals specific distribution of CARHigh T cells.
Annotation and further analysis of CARHigh T in the single-cell data were performed by applying the gene signatures, developed in this work, associated to both CD4+ and CD8+ CARHigh T cells that showed higher correlation with the CAR protein level than that yielded by the CAR gene expression. (A) UMAP plot showing CARHigh T cell distribution across analyzed cells. (B) Quantification of the percentage of CARHigh T cell along the different clusters. In accordance with phenotypic results, CARHigh T cells are mainly localized within activated CD4+ cells (clusters 6 and 17) and pre-exhausted CD8+ T cells (cluster 9). (C) UMAP plots overlaid with the score of activation and tonic signaling signatures, showing their distribution across cells. CARHigh T cells were enriched in the score for both signatures. (D) Quantification of the signature score in CARHigh T cells from clusters 6 (CD4+ activated), 8 (CD8+ cytotoxic), and 9 (CD8+ pre-exhausted), in comparison with the rest of the cells, for both activation and tonic signaling signatures. CARHigh T cells presented a significant increase for both signatures in almost all three clusters analyzed. Wilcoxon test (D). ***P < 0.001.

