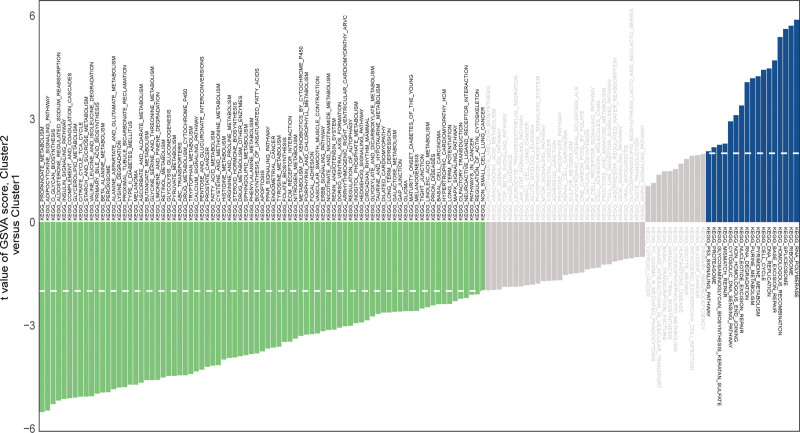
Figure 4.
The GSVA analysis based on the KEGG pathway. The t values of each pathway in the high and low risk group on the vertical axis to represent the difference values. Negative values (green) indicate activation of the pathway in the low expression group, and positive values (blue) indicate activation of the pathway in the high expression group. GSVA = gene set variation analysis, KEGG = Kyoto encyclopedia of genes and genomes.

