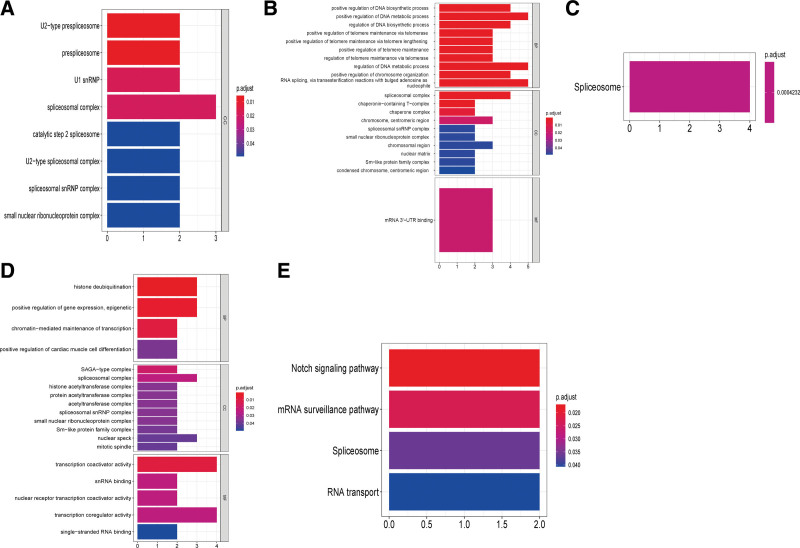
Figure 8.
Functional enrichment analysis of key snoRNAs relating genes in HCC. GO enrichment analysis of top 20 different mRNAs related to SNORA11(A), SNORD46(B), SNORD124 (D). The horizontal axis represents the gene proportion of the GO entry, that is, the number of differential genes contained in the GO entry; The vertical axis represents the name of the GO entry and the color representation -log10P-value. KEGG enrichment analysis of 20 different mRNAs associated with SNORD46 (C), SNORD124 (E). The horizontal axis represents the proportion of genes in the KEGG pathway, that is, the number of differential genes in the pathway. The vertical axis represents the name of the KEGG pathway and the color representation -log10 P value. GO = gene ontology, HCC = hepatocellular carcinoma, KEGG = Kyoto encyclopedia of genes and genomes, snoRNAs = small nuclear RNAs.

