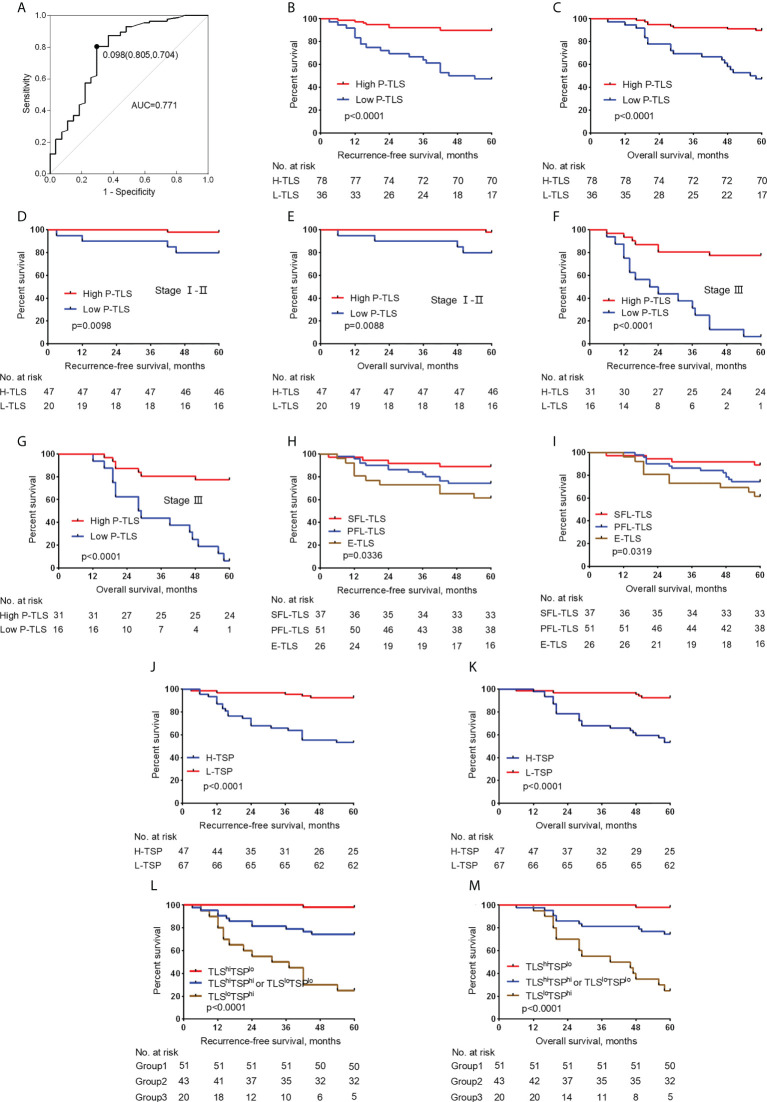
Figure 4.
Relationship between the P-TLS and TSP and prognosis of nmCRC in the training set. (A) ROC curve of P-TLS density and patient prognosis. The optimum cut-off is 0.098, and when using this point for segmentation, the sensitivity is 0.805 and the specificity is 0.704. Association of the P-TLS density with RFS (B) and OS (C), and TNM I-II (D, E) and III (F, G) CRC patients. Association of the P-TLS maturation stage with RFS (H) and OS (I). Association of the TSP with RFS (J) and OS (K). Kaplan-Meier survival analyses for RFS (L) and OS (M) were performed according to group 1, group 2, and group 3. Group 1: TLShiTSPlo group, group 2: TLShiTSPhi or TLSloTSPlo group, and group 3: the TLSloTSPhi group.

