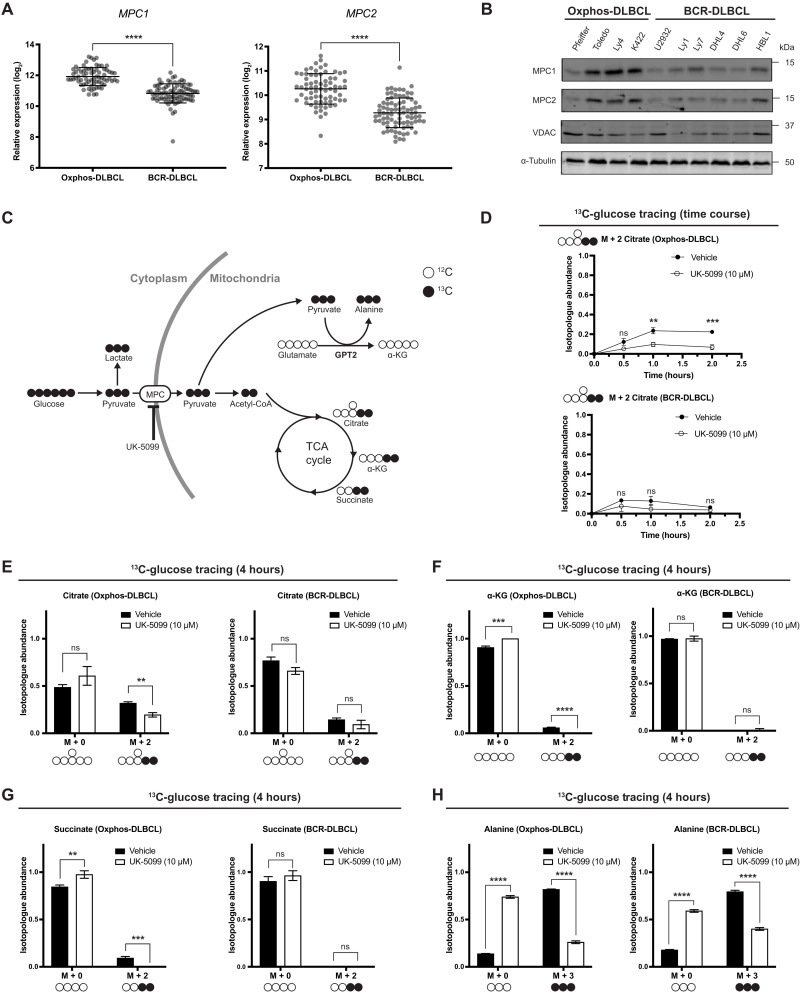
Fig. 1. OxPhos- and BCR-DLBCLs have similar pyruvate metabolic profiles.
(A) Aggregated MPC1 and MPC2 mRNA expression data from 71 OxPhos- and 83 BCR-DLBCL patient samples. Data from GSE10846. (B) Western blot analysis of MPC1, MPC2, VDAC, and α-tubulin from a panel of OxPhos- and BCR-DLBCL cell lines. (C) Schematic of d-[U-13C]-glucose tracing. MPC, mitochondrial pyruvate carrier; UK-5099, MPC inhibitor; α-KG, α-ketoglutarate; GPT2, glutamate pyruvate transaminase 2. (D) Quantification of the isotopologue abundance of M + 2 citrate in OxPhos- and BCR-DLBCL cells cultured with d-[U-13C]-glucose ± the MPC inhibitor UK-5099 for 30 min, 1 hour, and 2 hours. Isotopologue abundance is the mean of n = 3 independent biological experiments, ± SD. (E to G) Quantification of the isotopologue abundances of M + 0 and M + 2 citrate, M + 0 and M + 2 α-KG, and M + 0 and M + 2 succinate in OxPhos- and BCR-DLBCL cells cultured with d-[U-13C]-glucose ± the MPC inhibitor UK-5099 for 4 hours. Isotopologue abundance is the mean of n = 3 independent biological experiments, ± SD. (H) Quantification of the isotopologue abundances of M + 0 and M + 3 alanine in OxPhos- and BCR-DLBCL cells cultured with d-[U-13C]-glucose ± the MPC inhibitor UK-5099 for 4 hours. Isotopologue abundance is the mean of n = 3 independent biological experiments, ± SD. Vehicle: Dimethyl sulfoxide (DMSO), ns, P > 0.05; *P < 0.05; **P < 0.01; ***P < 0.001; ****P < 0.0001. Data were analyzed by one-way ANOVA followed by Dunnett’s multiple comparison test.

