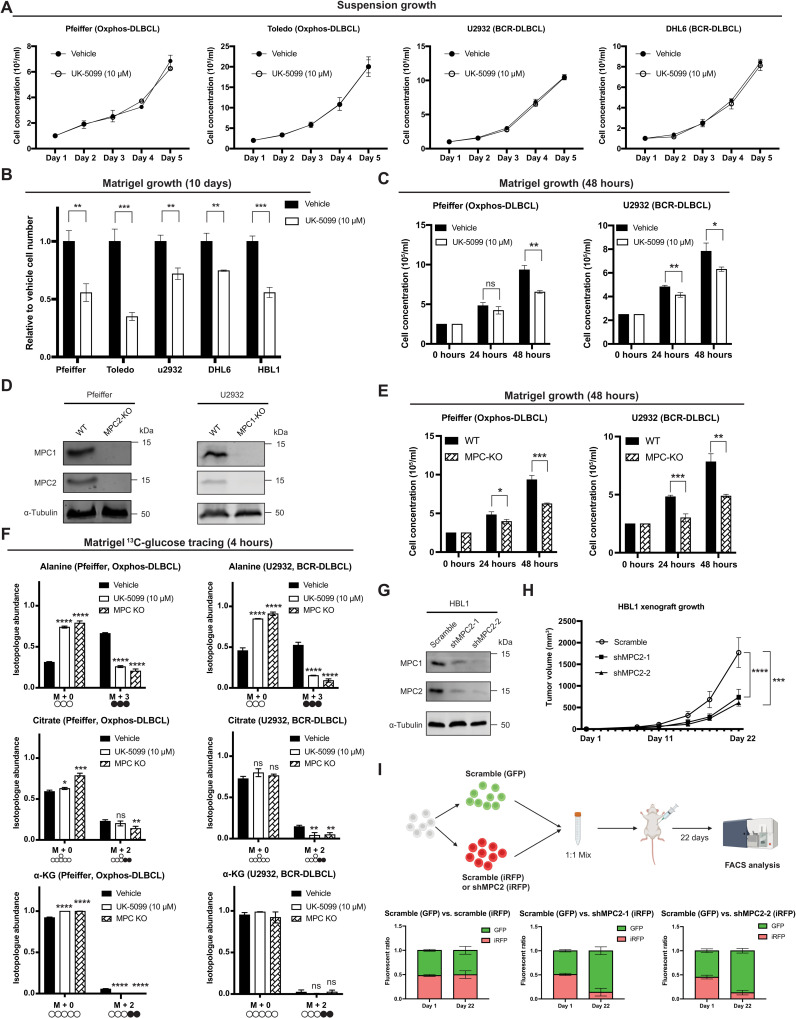
Fig. 3. MPC inhibition reduces DLBCL proliferation in Matrigel.
(A) Growth of cells cultured in suspension ± UK-5099. (B) Growth of cells cultured in Matrigel ±UK-5099. (C) Growth of cells cultured in Matrigel ± UK-5099. (D) Western blot analysis of MPC1, MPC2, and α-tubulin in wild-type (WT) and MPC knockout (MPC KO) DLBCL cell lines. (E) Growth of MPC KO cell lines and their WT controls in Matrigel. (F) Isotopologue abundances of M + 0 and M + 3 alanine, M + 0 and M + 2 citrate, and M + 0 and M + 2 α-KG from DLBCL WT or MPC KO cells in Matrigel with d-[U-13C]-glucose ±UK-5099 for 4 hours. (G) Western blot analysis of MPC1, MPC2, and α-tubulin in control (Scramble) and MPC2 knockdown (shMPC2-1 and shMPC2-2) HBL1 cells. (H) Xenograft tumor volume of Scramble, shMPC2-1, and shMPC2-2 HBL1 cell lines. Tumor volumes were determined by caliper measurement and are the mean of n = 10, ± SEM, analyzed by two-way ANOVA. (I) Top: Experiment schematic. Bottom: GFP:iRFP ratios of tumors from Scramble-GFP + Scramble-iRFP, Scramble-GFP + shMPC2-1–iRFP, and Scramble-GFP + shMPC2-2–iRFP in mice at day 1 and day 22. Values are the mean of n = 3 (day 1) and n = 10 (day 22) ± SD. Vehicle: DMSO. (A to F) Values are the mean of n = 3 independent biological experiments, ± SD, analyzed by one-way ANOVA. ns, P > 0.05; *P < 0.05; **P < 0.01; ***P < 0.001; ****P < 0.0001.

