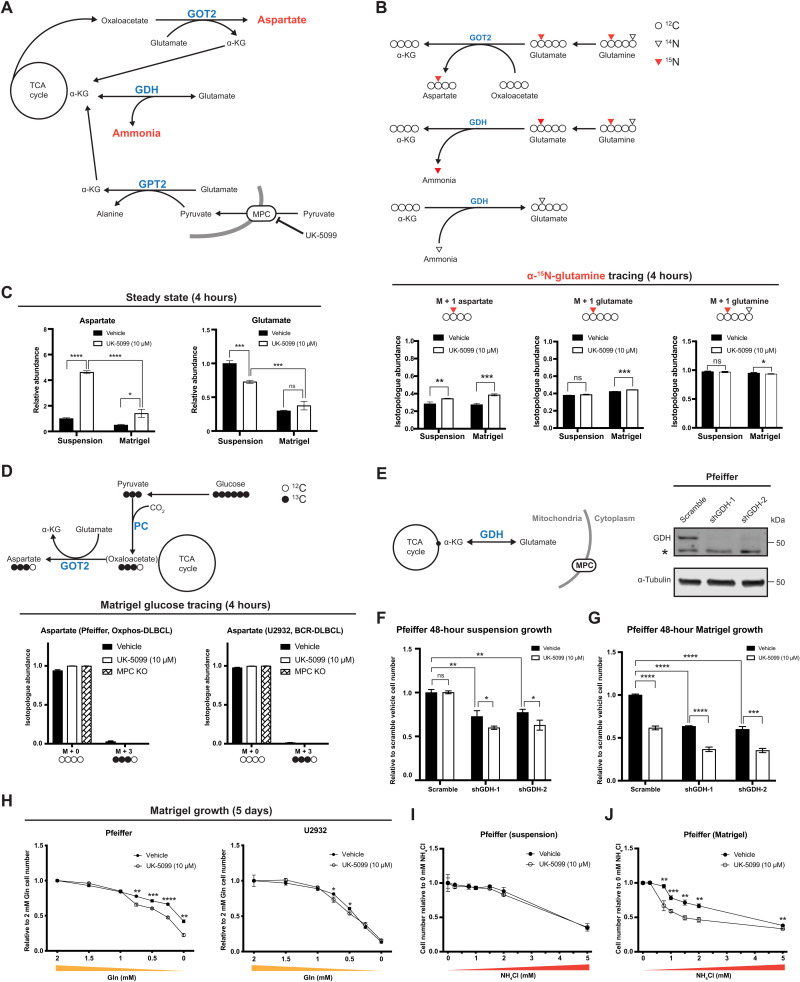
Fig. 5. MPC inhibition enhances the sensitivity of DLBCLs to ammonia in Matrigel.
(A) Schematic of α-KG production by GPT2, GOT2, and GDH. (B) Top: Schematic of l-[α-15N]-glutamine tracing. Bottom: Isotopologue abundances of M + 1 aspartate, M + 1 glutamate, and M + 1 glutamine in cells cultured in suspension or Matrigel with l-[α-15N]-glutamine ± UK-5099 for 4 hours. (C) Relative steady-state abundance of unlabeled aspartate and glutamate from U2932 cells cultured in suspension or Matrigel ± UK-5099 for 24 hours. (D) Top: Schematic of d-[U-13C]-glucose tracing. Bottom: Isotopologue abundances of M + 3 aspartate in cells cultured in Matrigel with d-[U-13C]-glucose ± UK-5099 or MPC knockout for 4 hours. (E) Left: Schematic of GDH-mediated α-KG production. Right: Western blot of GDH and α-tubulin in Scramble, shGDH-1, and shGDH-2 Pfeiffer cells. *Nonspecific band. (F and G) Growth of Scramble, shGDH-1, and shGDH-2 Pfeiffer cells in suspension or Matrigel ± UK-5099 for 48 hours. Cell numbers are relative to Scramble with vehicle. (H) Growth of Pfeiffer and U2932 cells in Matrigel supplemented with 0, 0.25, 0.5, 0.75, 1, 1.5, or 2 mM glutamine ± UK-5099. Values are relative to 2 mM glutamine with vehicle. (I and J) Growth of Pfeiffer cells in suspension or Matrigel with 0, 0.3, 0.75, 1, 1.5, 2, or 5 mM NH4Cl ± UK-5099 for 48 hours. Values are relative to 0 mM NH4Cl ± UK-5099. Vehicle: DMSO values for (B) to (D) and (F) to (J) are the mean of n = 3 independent biological experiments, ± SD. P value and data analysis are the same as in Fig. 4.

