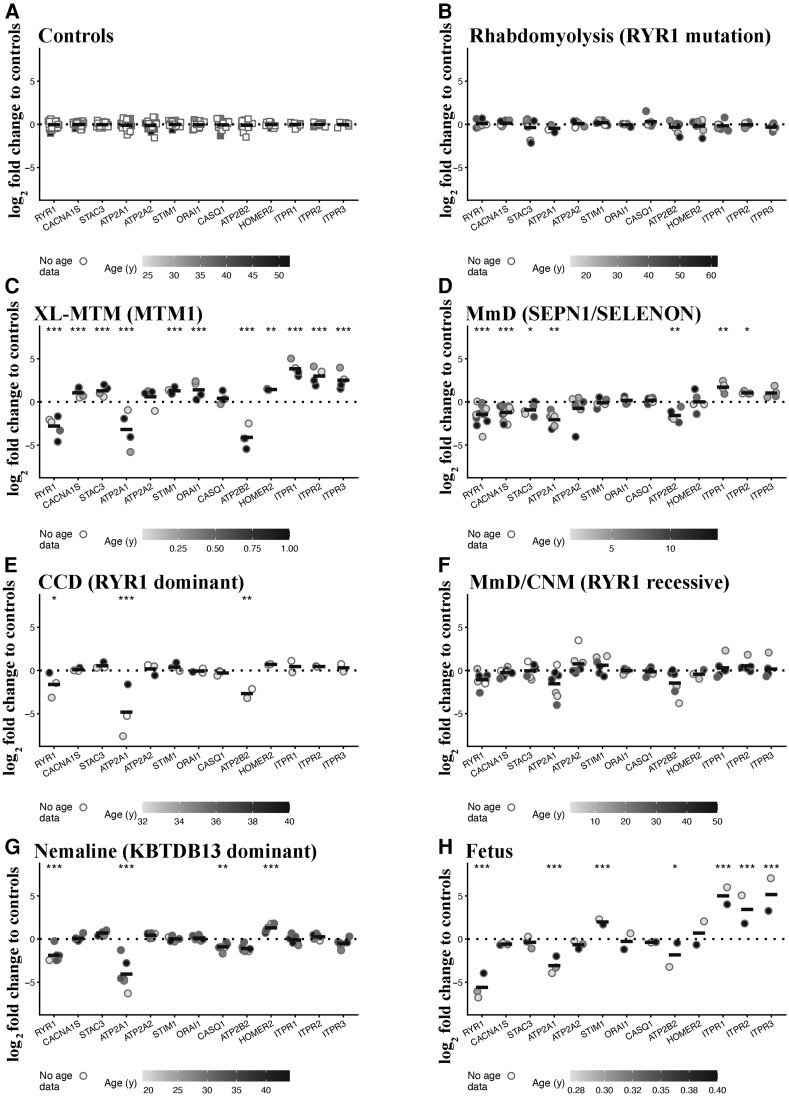
Figure 1.
Muscles from patients with CM show significant changes in the expression levels of transcripts encoding proteins involved in ECC and calcium homeostasis. Expression levels of the indicated transcripts were determined by qPCR and normalized to the expression of DES. Muscle biopsies were from: (A) healthy controls; (B) patients with exertional rhabdomyolysis/heat stroke/exercise intolerance carrying RYR1 mutations; (C) patients with MTM1-related XL-MTM; (D) patients with AR SELENON-related MmD; (E) patients with AD-RYR1-related CCD; (F) patients with AR RYR1-related MmD/CNM; (G) patients with AD KBTBD13-related nemaline myopathy; (H) foetuses. The greyscale given to the symbols reflects the age range of the patients and the scale bar at the bottom of each panel correlates greyscale to age. Empty symbols represent patients or probands whose age was not known. Square symbols represent results from controls; circles represent results from disease patients and foetuses. The relative transcript expression in patient muscles was compared with that in muscles from healthy controls that was set to 1. Statistical analysis was performed using the ‘R’ version 4.2.0 running on platform x86_64-apple-darwin13.4.0 (64 bits). Comparisons of each disease group (or foetus) to controls were calculated using the limma package24 of ‘R’. Obtained P-values were adjusted for multiple testing using Benjamini–Hochberg method to control the false discovery rate. Means were considered statistically significant, when the adjusted P-values were <0.05. The horizontal black bar represents the mean content levels in patient muscles. *P < 0.05; **P < 0.01; ***P < 0.001.

