Fig. 5.

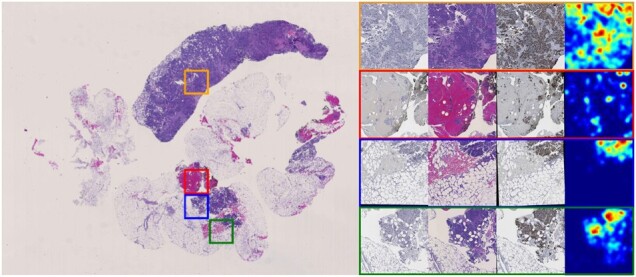
Attention for a typical case is presented. The H&E WSI is presented on the left panel. Close up views of four sampled regions in H&E, Ki67 and PHH3 and their attention maps are presented on the right panel

Attention for a typical case is presented. The H&E WSI is presented on the left panel. Close up views of four sampled regions in H&E, Ki67 and PHH3 and their attention maps are presented on the right panel