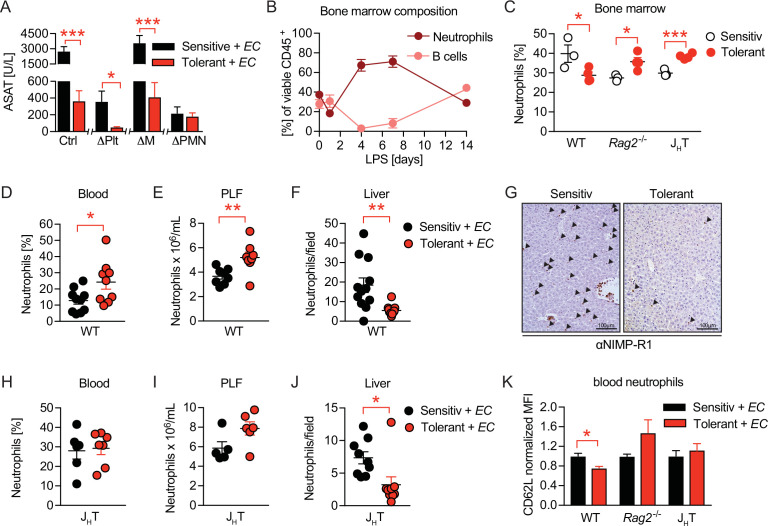
Figure 4. B cells impact neutrophils, the key effectors driving sepsis-induced tissue damage.
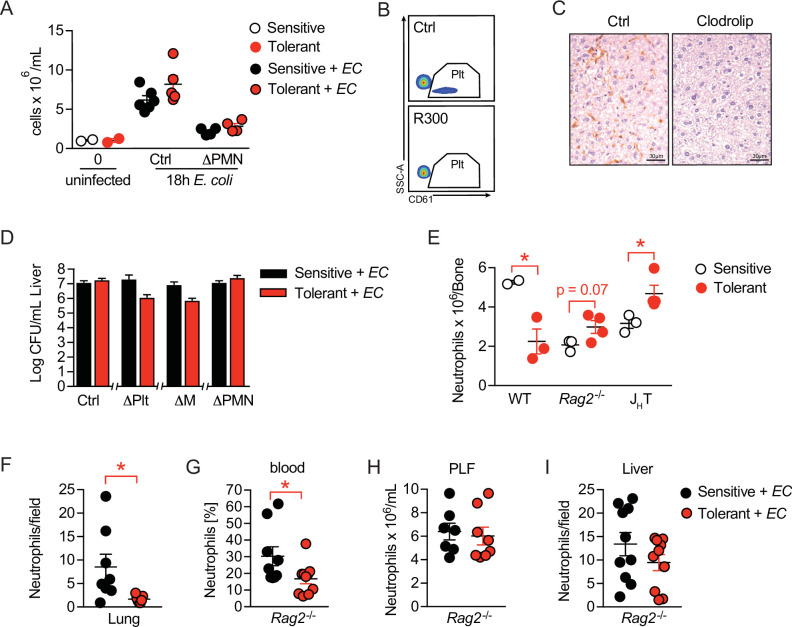
(A) Aspartate aminotransferase (ASAT) plasma levels 18 hr p.i. with E. coli in lipopolysaccharide (LPS) or NaCl pretreated mice, in which platelets, monocytes/macrophages, or neutrophils, respectively, were depleted before infection. (B) Flow-cytometric analysis of bone marrow neutrophils and B cells after i.v. administration of LPS at time = 0 hr. (C) Flow-cytometric analysis of neutrophils in the bone marrow of wildtype, Rag2-/- and JHT mice 2 weeks after LPS or NaCl treatment. (D–E) Flow-cytometric analysis of neutrophils of wildtype mice pre-treated with NaCl or LPS, respectively, and infected for 18 hr with E. coli, in blood (D) and peritoneal lavage fluid (PLF) (E). (F–G) Quantification of (F) immunohistological staining for NIMP-R1+ cells on liver sections (G) of mice pretreated with NaCl or LPS, respectively, and infected with E. coli for 18 hr. (H–J) Flow-cytometric analysis of neutrophils 18 hr p.i. with E. coli in blood (H), PLF (I), and liver (J) of JHT mice. (K) Flow-cytometric analysis of blood neutrophil CD62L expression of WT, Rag2-/- and JHT mice at 18 hr p.i. with E. coli. Data in (A) shown for the control group and neutrophil depletion are pooled from two independent experiments (n=4–6/experimental group), platelet and monocyte/ macrophage depletion represent a single experiment (n=8/group). Data in (B), (D–E), (F), and (J) are pooled from two independent experiments (n=4–8/experimental group). Data in (H–I) are representative of two experiments (n=5–8/group). Data in (K) are from a single experiment (n=4–8/group). All data are presented as mean +/-SEM. * p≤0.05, ** p≤0.01 and *** p≤0.001.


