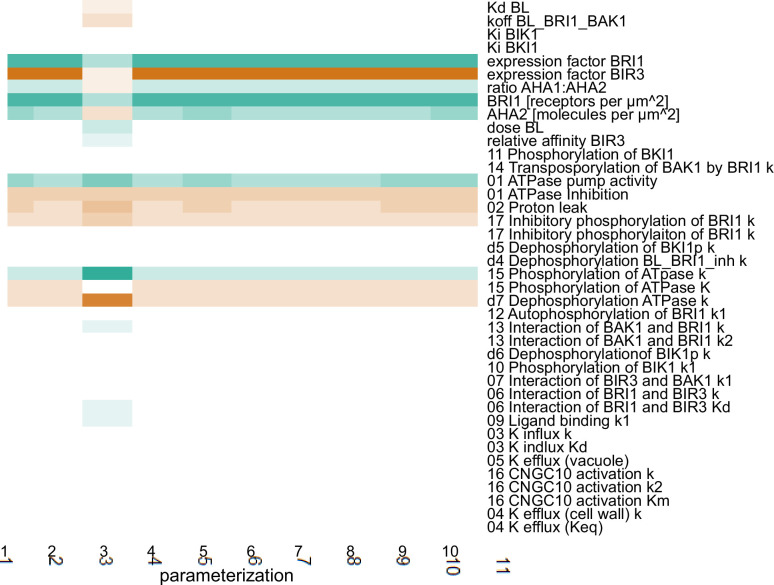
Appendix 1—figure 4. Scaled sensitivities of the pH change 60 min after stimulation with 10 nM BL in response to changes in the parameter and global quantities values.
Color code: red - negative control, white - no influence, green - positive control. Color saturation indicates strength of the influence.

