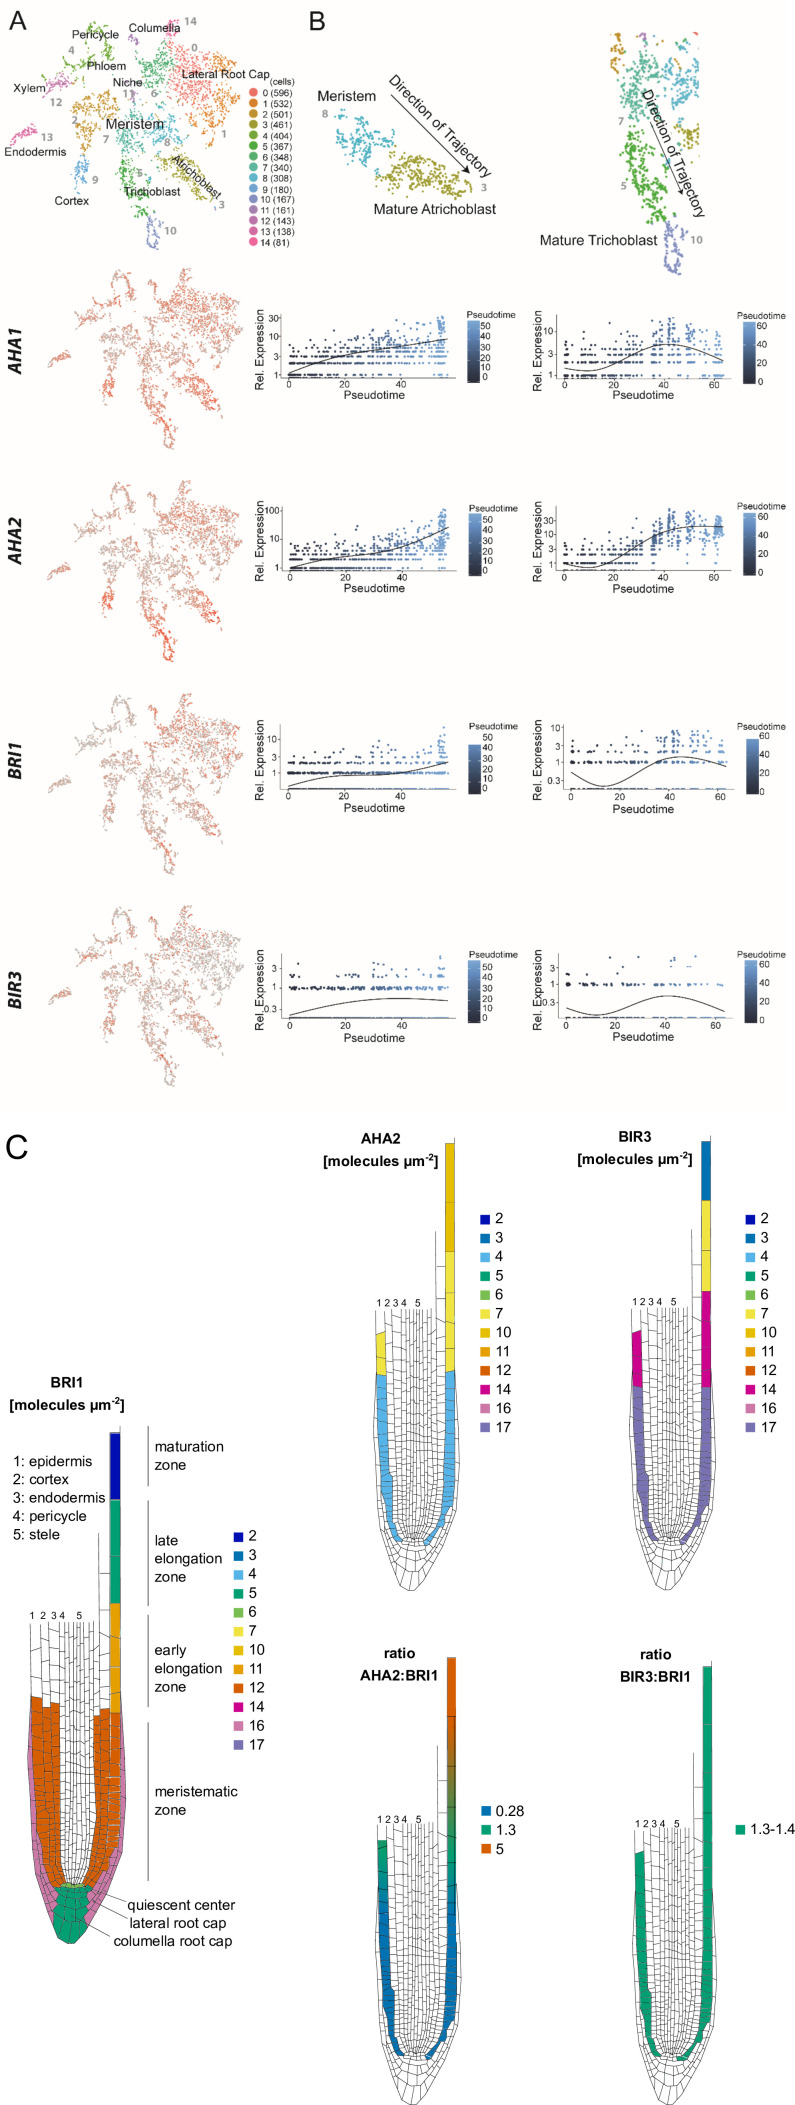
Figure 3. The constituents of the nano-scale organized BRI1 complex are spatio-temporally differentially expressed in the epidermal cells along the Arabidopsis root tip axis.
(A) AHA1, AHA2, BIR3 and BRI1 transcript levels in the different cell types of the Arabidopsis root tip derived from scRNA-Seq data (Ma et al., 2020). The atrichoblasts and trichoblasts together represent the epidermal cells. (B) Developmental trajectories of AHA1, AHA2, BIR3, and BRI1 transcript accumulation along the root tip (Ma et al., 2020). The transition from the MZ to the EZ is at a pseudotime value of around 30. (C) Upper panel. Number of the indicated GFP fusion proteins (molecules per µm2) in the plasma membrane of epidermal cells along the root tip axis. The values for BRI1-GFP and BAK1-GFP were taken from the literature (Wilma van Esse et al., 2011). Lower panel. The same but here the ratios of BRI1-GFP/AHA2-GFP and BRI1-GFP/BIR3-GFP molecules in the plasma membrane are given.

