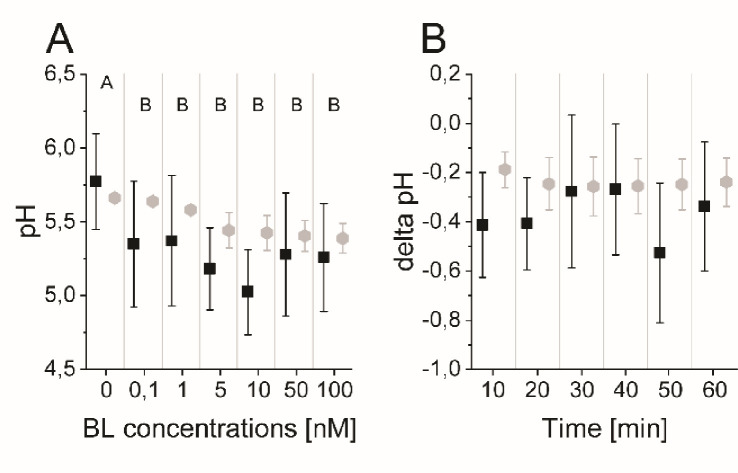
Figure 6. The model quantitatively and dynamically captures the sensitivity and kinetics of apoplastic acidification in Arabidopsis epidermal cells of the root MZ in response to BL.
(A) HPTS-staining visualized (black quadrats) and computationally simulated (grey diamonds) dose-response behavior of apoplastic pH. Real or virtual BL incubation was done for 60 min. Error bars represent SD for the experimental data (n≥11) and the simulations of different model parameterizations (n = 10). Statistical evaluations on experimental data were performed as described in Figure 4. Levels not connected by same letter are significantly different. The exact p-values can be found in the corresponding RAW data file (B) HPTS-staining visualized (black quadrats) and computationally simulated (grey diamonds) time-course of apoplastic pH change in response to 10 nM BL. Error bars represent a corrected SD for the experimental data (n≥16) (for calculation see the corresponding RAW data file) and SD for the simulations of different model parameterizations (n = 10). Statistical evaluations on experimental data were performed as described in Figure 4.

