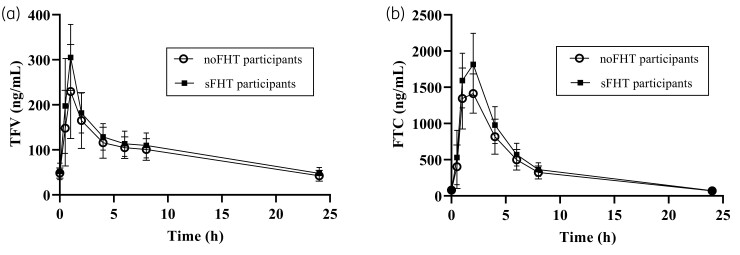
Figure 2.
Concentration versus time at short-term PK assessment of noFHT and sFHT participants. Plasma tenofovir (TFV) and emtricitabine (FTC) at pre-dose and 0.5, 1, 2, 4, 6, 8 and 24 h in TGW are shown in (a) and (b), respectively, for noFHT participants (no FHT, PrEP only; circles, n = 12) and sFHT participants (PrEP plus standardized FHT; squares, n = 18). Data are means with error bars indicating SDs.

