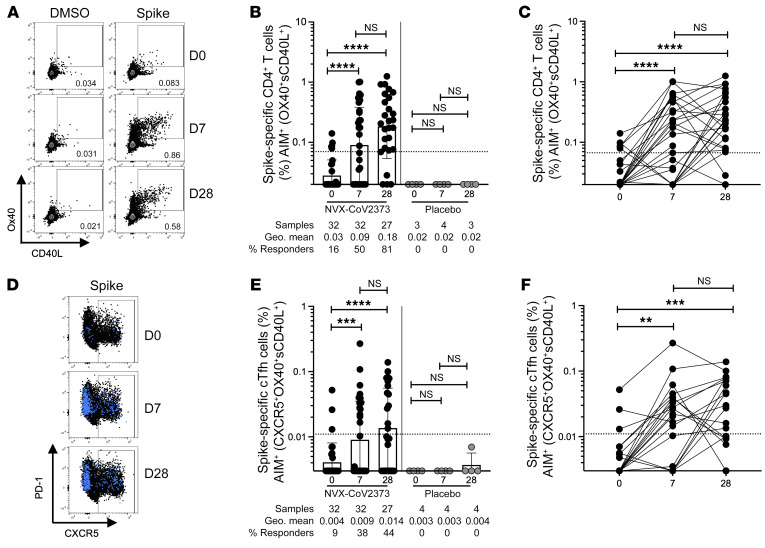
Figure 1. Spike-specific CD4+ T cells following NVX-CoV2373 vaccination.
(A) Representative FACS plots of AIM+ (sCD40L+OX40+) CD4+ T cells on day 0 (D0), D7, and D28 after vaccination. (B and C) Spike-specific AIM+ CD4+ T cell responses in vaccinees (black dots) and placebo controls (gray dots). The same data are graphed as grouped (B) and paired comparisons (C). (D) Representative FACS plots of AIM+CXCR5+ CD4+ cTfh cells (blue dots are AIM+ CD4+ T cells overlaid on total CD4+ T cells in black). (E and F) Spike-specific AIM+ cTfh cell responses in vaccinees and placebo controls. The same data are graphed as grouped (E) and paired comparisons (F). Dotted line indicates limit of quantitation (LOQ) for the assay, and was calculated as the geometric mean of all sample DMSO wells multiplied by the geometric SD. Percentage responders are calculated as responses ≥ LOQ divided by the total samples in the group. Paired data were analyzed by Wilcoxon’s signed-rank test. Data shown as geometric mean ± geometric SD. **P < 0.01; ***P < 0.001; ****P < 0.0001.

