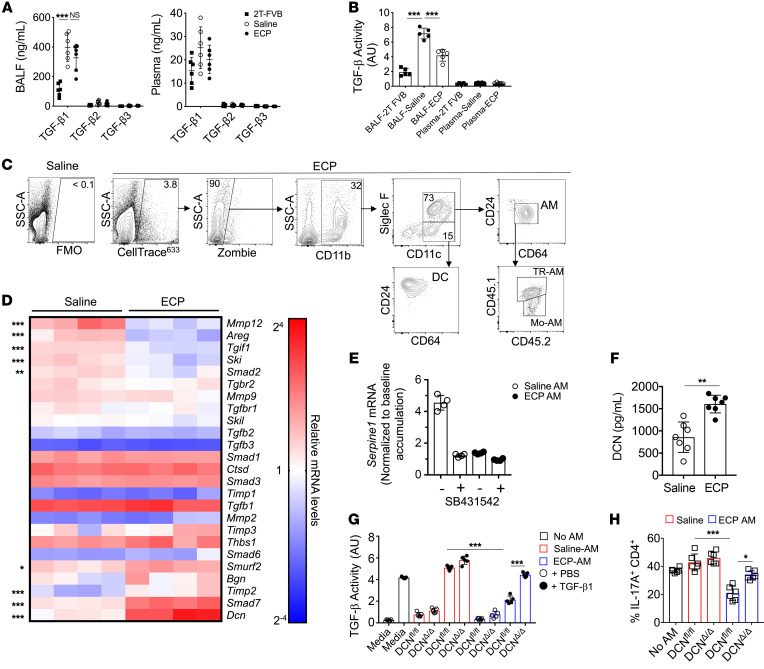
Figure 2. ECP reprograms AMs to antagonize TGF-β bioavailability.
POD16 2T-FVB and 3T-FVB allograft (A) BALF and plasma analyzed for TGF-β isoform protein content by ELISA (n = 6/group) or (B) activity with a HEK293 SMAD 2/3 luciferase reporter cell line (n = 5/group). AU, arbitrary luciferase units. Data shown for A and B are representative results from 2 experiments. (C) CellTrace633-labeled ECP-treated leukocytes injected into 3T-FVB allograft and analyzed for uptake by intragraft CD11b+ phagocytes. Data shown are representative results from 4 experiments. (D) Heatmap of saline- and ECP-treated POD16 3T-FVB allografts, AM transcript levels of TGF-β signaling, and fibrosis-related gene targets normalized to the macrophage housekeeping gene Stx5a. (n = 4/group) (E) Fold accumulation of TGF-β–induced AM Serpine1 mRNA accumulation in the presence or absence of 10 μM SB43152 or vehicle (DMSO) (n = 4/group). Data shown are normalized to baseline levels (non–TGF-β–treated DMSO-pretreated controls). (F) Saline- and ECP-treated AMs were cultured overnight and analyzed by ELISA for DCN secretion (n = 7/group). (G) TGF-β activity measurements of enriched supernatants from saline- or ECP-treated DCNΔ/Δ and DCNfl/fl AMs cultured with or without 10 ng/ml TGF-β1 (n = 5/group). Data shown in F and G are representative results from 2 experiments. (H) Naive B6 CD4+ T cells were stimulated with plate-bound CD3ε and CD28 Abs in the presence or absence of indicated AM-conditioned supernatants added at a 1:1 v/v ratio to Th17 polarization medium that contained 10 ng/ml TGF-β1 (n = 5/group). Intracellular IL-17A expression was assessed 4 days later. Data are represented as mean ± SD. One-way ANOVA with Dunnett’s multiple-comparison test (A, B, G, and H); 2-sided Mann-Whitney U test (D and F). *P < 0.05; **P < 0.01; ***P < 0.001.

