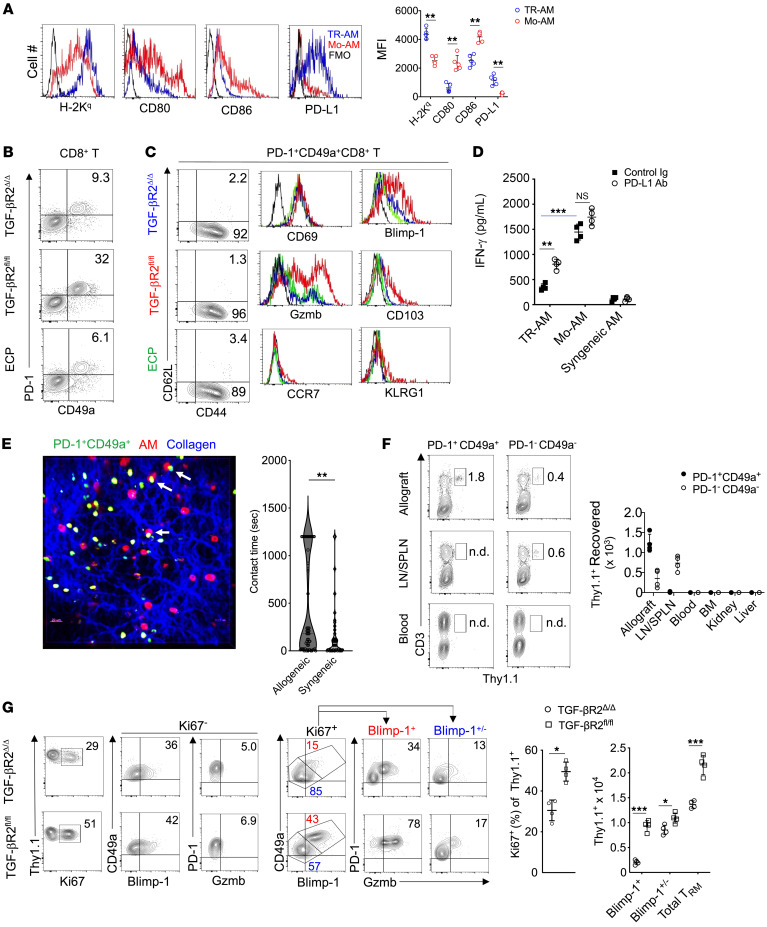
Figure 8. Mo-AM generation promotes TRM cell activation and expansion.
(A) A representative FACS plot set from 4 transplants where MFI is shown for TR-AM and Mo-AM MHC I H-2Kq, CD80, CD86, and PD-L1 expression levels. FMO, fluorescence-minus-one control. (B and C) Representative FACS plots and histograms for n = 4/group for the expression of TRM cell markers with FMO (black lines). (D) FACS-sorted 3T-FVB TR-AMs, Mo-AMs, and B6 AMs were cultured with FACS-sorted 3T-FVB allograft PD-1+CD49a+CD8+ T cells with 10 μg/ml control rat Ig or PD-L1–neutralizing Abs and then assessed for IFN-γ production by ELISA 72 hours later. Data shown are representative results from 2 experiments. (E) FACS-sorted, CFSE-labeled 3T-FVB allograft PD-1+CD49a+CD8+ T cells (green) were intratracheally administered to FVB (allogeneic) or B6 (syngeneic) lung transplants of B6 recipients. Eighteen hours later, transplants were imaged by 2-photon intravital microscopy immediately following the administration of Siglec F Abs to identify AMs (red). Representative intravital image from 1 of 4 FVB-transplanted lung studies. Arrows denote long-lasting contacts between TRM cells and AMs. Right panel shows violin plot of individual AM-TRM cell contact times from pooled data from 4 FVB (allogeneic) or B6 (syngeneic) transplanted lungs. (F) 2T-FVB allografts of B6 Thy1.1+ recipients were FACS-sorted for PD-1+CD49a+ and PD-1–CD49a– CD8+ T cells and intratracheally delivered into B6 Thy1.2+ recipients of 2T-FVB allografts and euthanized 1 month later. Shown are representative FACS plot results of Thy1.1+ cell percentage of abundance and cell count for indicated tissues (n = 4 per adoptive transfer). (G) 2T-FVB allograft FACS-sorted Thy1.1 PD-1+CD49a+CD8+ T cells were intratracheally administered into tamoxifen-treated TGF-βR2fl/fl and TGF-βR2Δ/Δ recipients of 3T-FVB allografts 3 days after DOX ingestion. Seventy-two hours later, recipients were euthanized. Data shown are representative FACS plots from n = 4/group for allograft percentage of abundance and cell counts. Data are represented as mean ± SD. Two-sided Mann-Whitney U test (A and G); 1-way ANOVA with Dunnett’s multiple-comparison test (D). *P < 0.05; **P < 0.01; ***P < 0.001.

