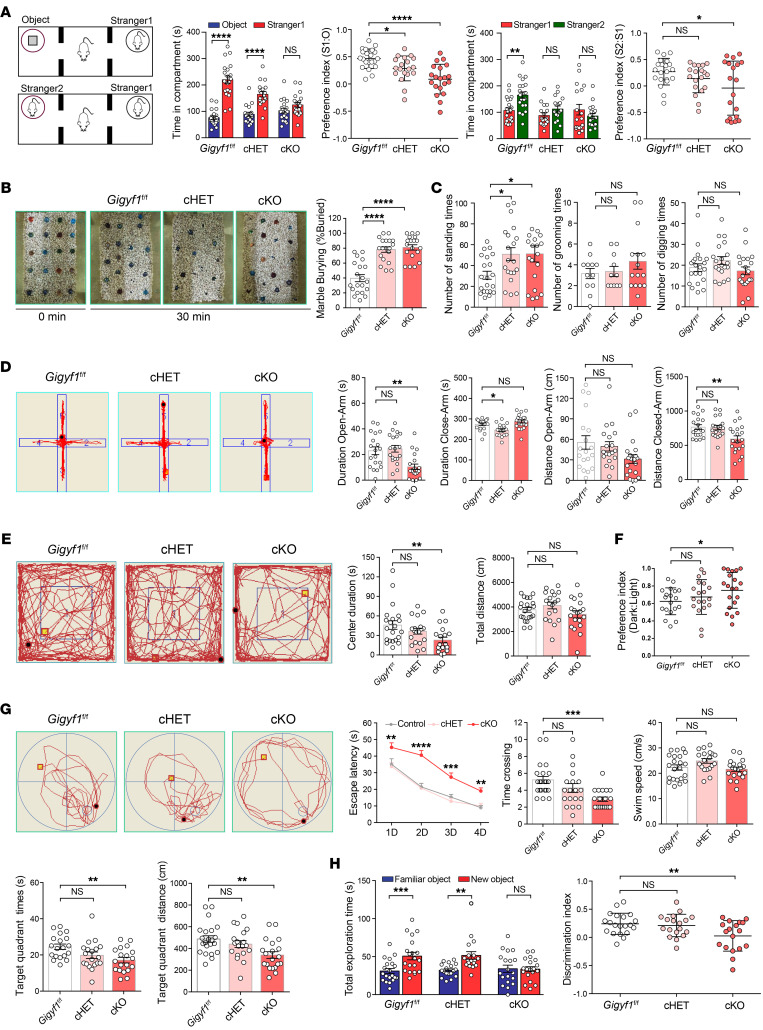
Figure 3. KO and haploinsufficiency of Gigyf1 in the developing mouse brain results in autism-like behaviors.
(A) Three-chamber test. The time spent with object (O), stranger 1 (S1) and stranger 2 (S2) was compared. The preference indexes were compared. n = 21 (Gigyf1fl/fl), 19 (cHET), 20 (cKO). Statistical data were analyzed using 1-way ANOVA and 2-tailed Student’s t test. (B) Marble burying test. The percentage of marbles buried by each mouse was compared. Statistical data were analyzed using 1-way ANOVA. (C) Digging, rearing, and grooming test. The numbers of digging, rearing, and grooming incidences of the different groups of mice were compared. n = 20 (Gigyf1fl/fl), 19 (cHET), 19 (cKO). Statistical data were analyzed using 1-way ANOVA. (D) Elevated plus-maze test. The time and the total distance in open and closed arms were compared. n = 19 (Gigyf1fl/fl), 19 (cHET), 20 (cKO). Statistical data were analyzed using 1-way ANOVA. (E) Open field test. The total distance and center duration were compared. n = 21 (Gigyf1fl/fl), 19 (cHET), 19 (cKO). Statistical data were analyzed using 1-way ANOVA. (F) Light-dark box test. The preference indexes to dark box were compared. n = 19 (Gigyf1fl/fl), 19 (cHET), 20 (cKO). Statistical data were analyzed using 1-way ANOVA. (G) Morris water maze test. The escape latency in the learning phase, the number of exact crossings over the previously hidden platform in the probe phase, the swim speed, and the time and distance in the target quadrant in the probe phase were compared. n = 22 (Gigyf1fl/fl), 19 (cHET), 20 (cKO). Statistical data were analyzed using 1-way and 2-way ANOVA. (H) Novel-object recognition test. Total exploration time and discrimination index were compared. n = 20 (Gigyf1fl/fl), 18 (cHET), 19 (cKO). Statistical data were analyzed using 1-way ANOVA and 2-tailed Student’s t test. All data are represented as mean ± SEM. *P < 0.05, **P < 0.01, ***P < 0.001, ****P < 0.0001. cHET, Gigyf1f/w-CreNestin; cKO,Gigyf1fl/fl-CreNestin.

